Panes of Heat
A window into hotter days and warmer nights across urban India
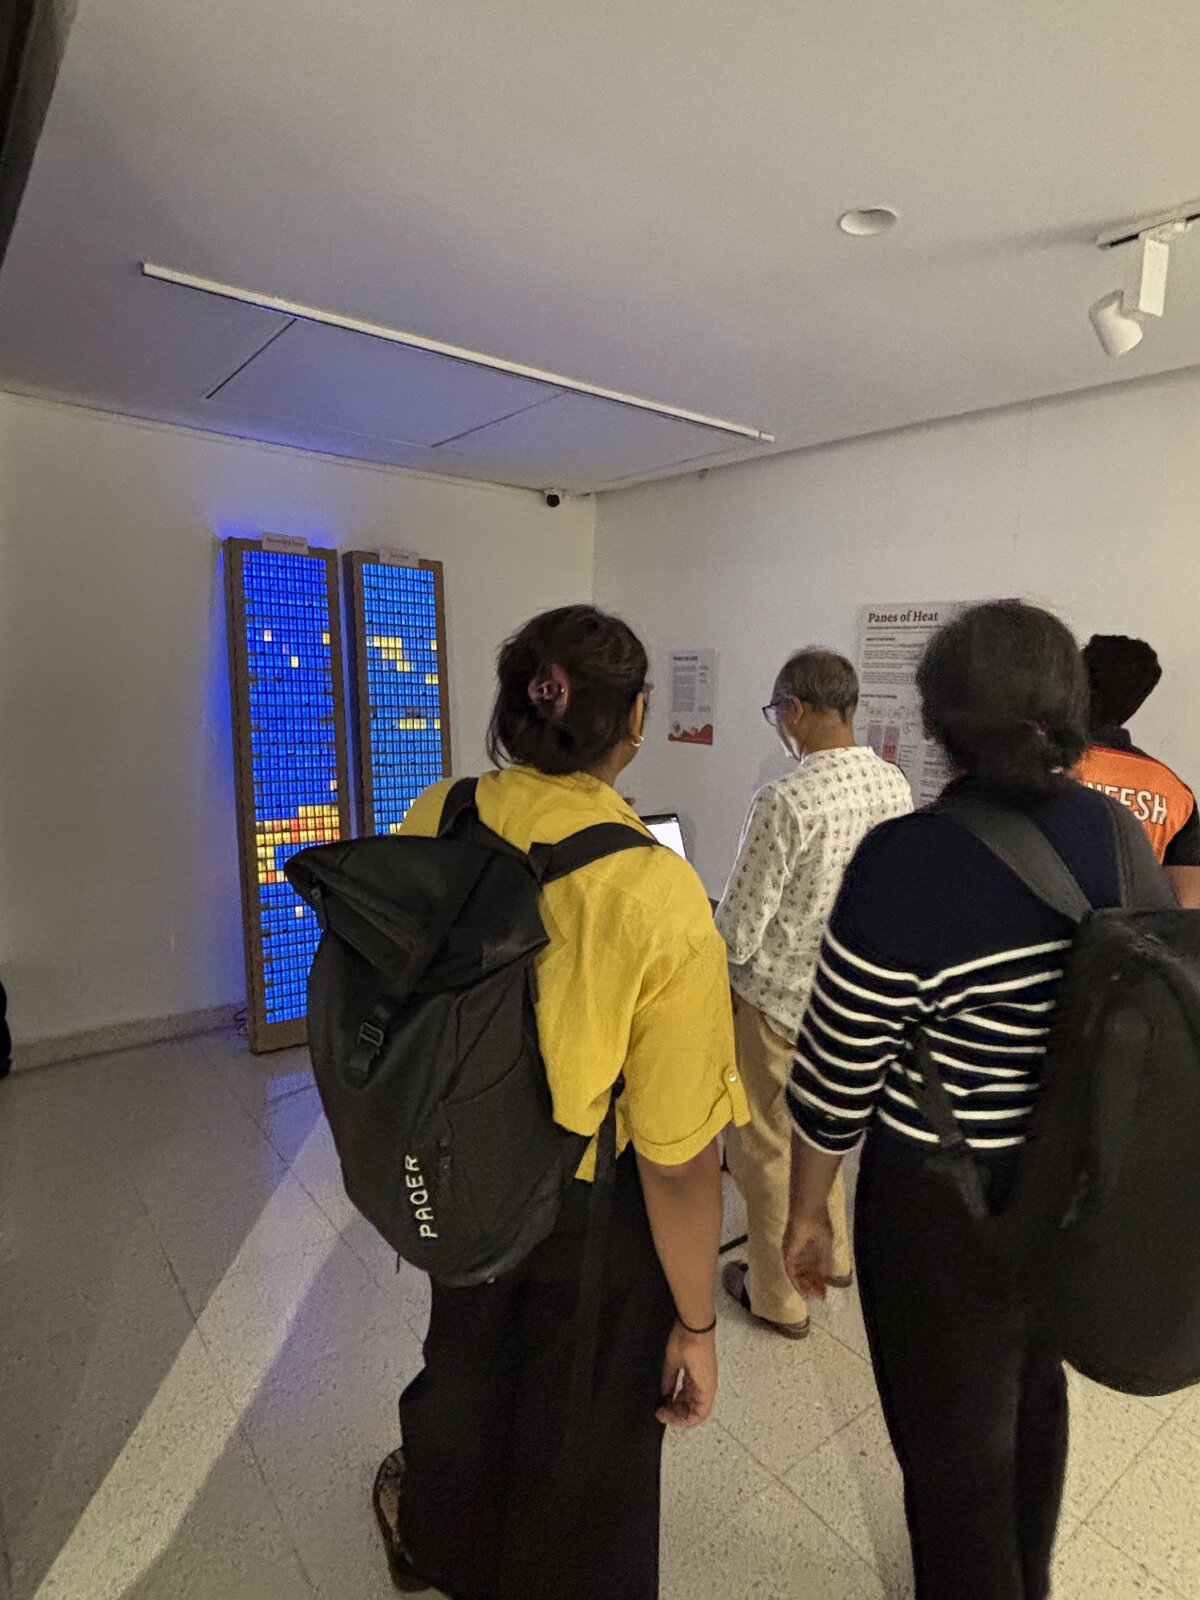
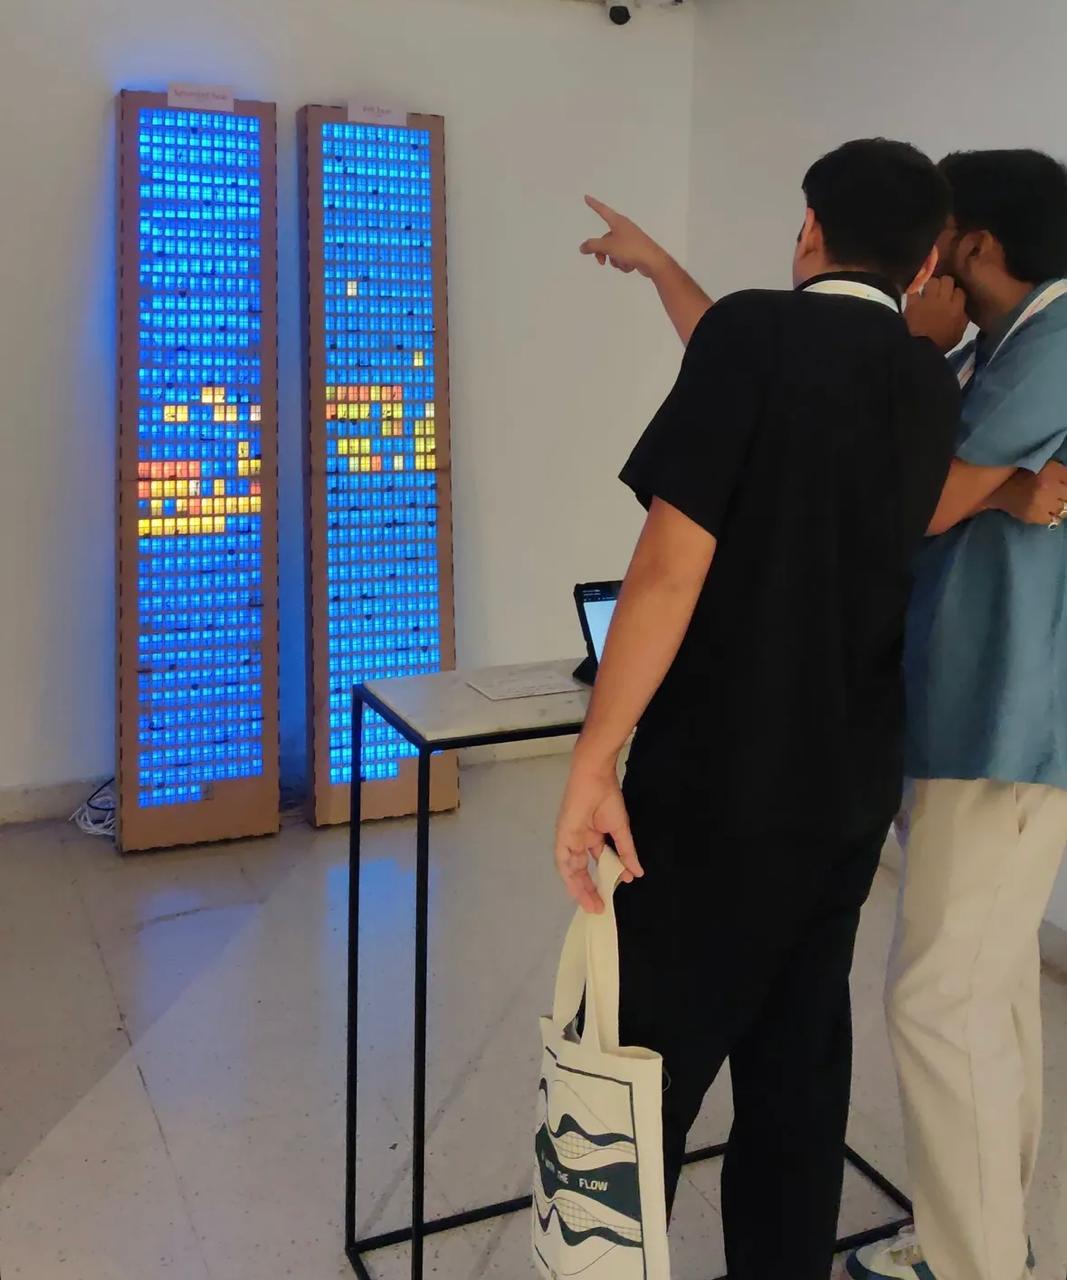
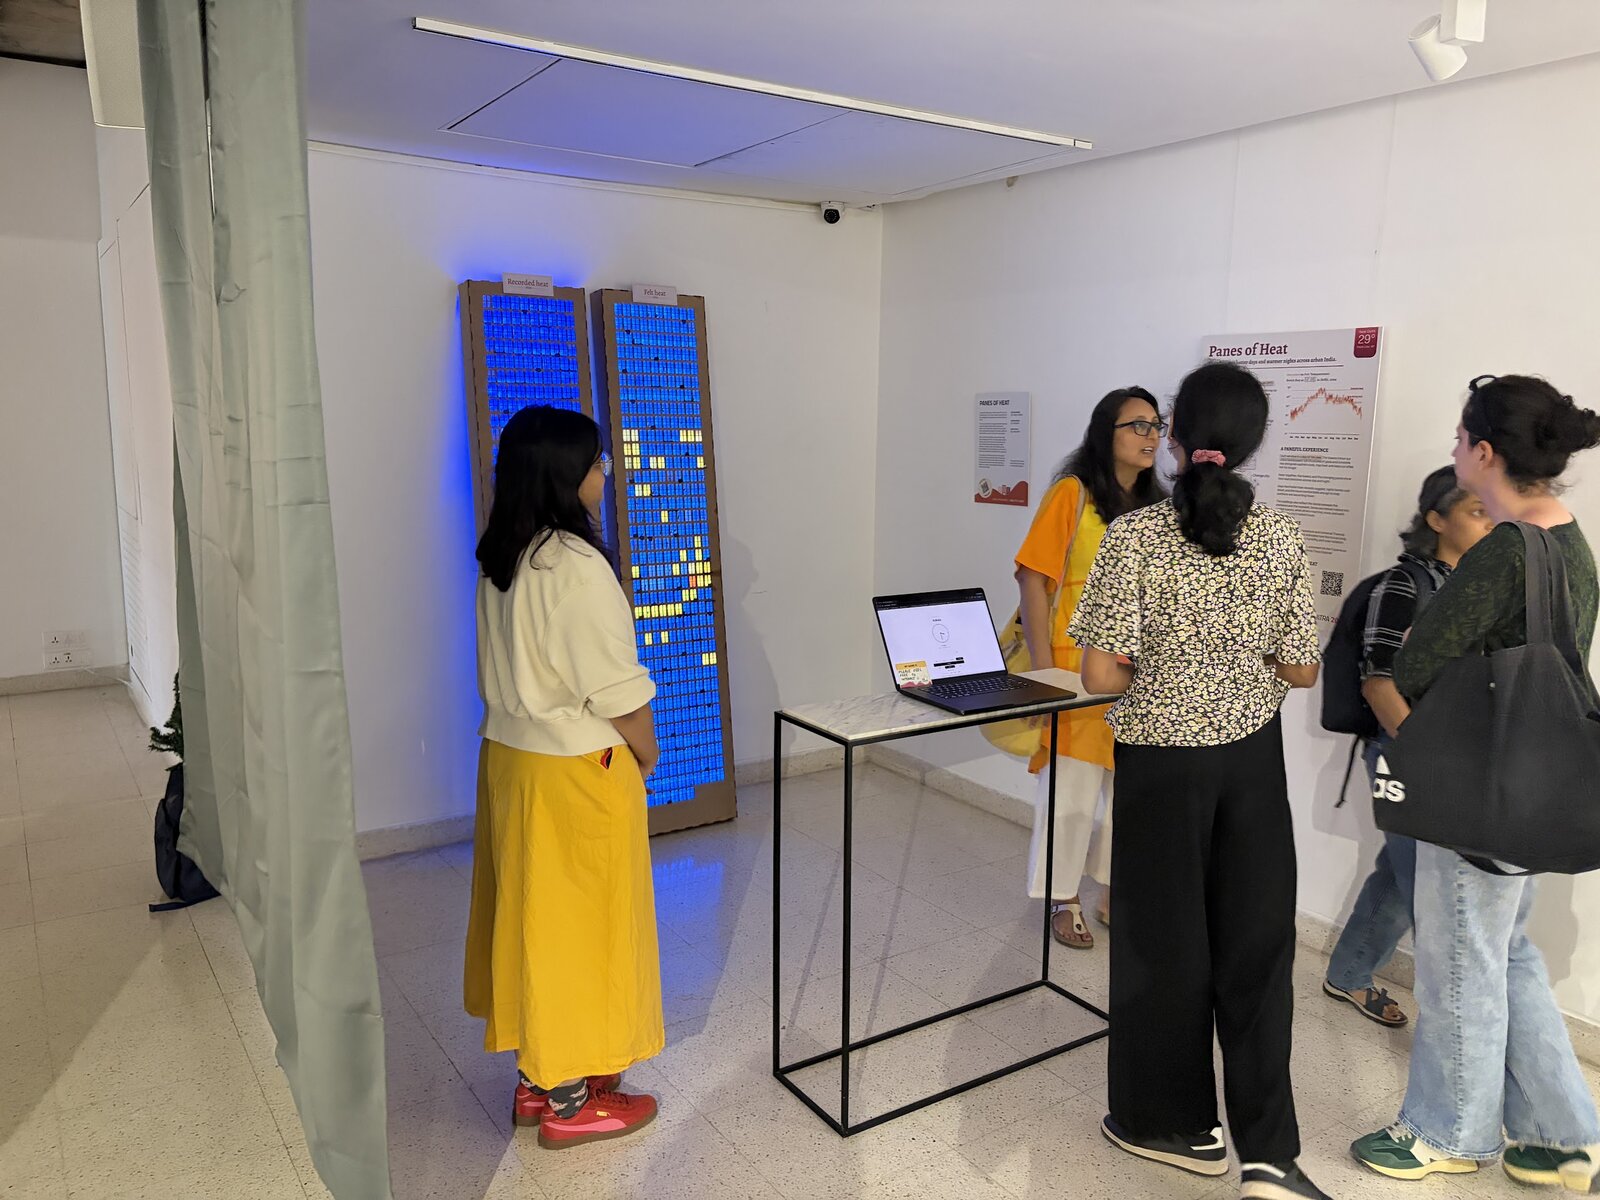
Created for Data, Otherwise, the tangible data exhibition on climate and ecological change at VizChitra 2026.
The world is entering an era of record-breaking heat. We’re living through the hottest decade since global temperature record-keeping began in 1850.
In 2024, the planet was warmer by over 1.5 °C above pre-industrial levels for the first time, crossing a critical climate threshold scientists have long warned about.
Globally, the year 2024 was the hottest on record, crossing the 1.5 °C threshold
Change in global temperatures since pre-industrial levels
Source: ERA5
Nowhere is this shift more intense than in India’s cities. Earlier this year, all 50 of the world’s hottest cities were in India. Banda, in Uttar Pradesh, recorded the highest temperature in the world even before the arrival of peak summer months. Across the country, heatwaves now arrive earlier and bring prolonged periods of brutal heat stress.
In a country with a large agricultural workforce, where millions more work outdoors on construction sites and city streets, the temperature reading tells only part of the story. Nearly half of India's workforce spends at least part of the day outdoors, and just one in ten households has access to cooling.
So it boils down to how the body experiences heat. Higher levels of heat stress increase the risk of dehydration, heatstroke and cardiovascular strain. This is why scientists use measures beyond recorded air temperature. One such measure is wet-bulb temperature, which combines heat and humidity to estimate how effectively the human body can cool itself through sweating.
The Universal Thermal Climate Index (UTCI) is another such measure. In addition to air temperature and humidity, it accounts for wind and solar radiation to estimate how hot conditions actually feel.
For this installation, we use UTCI to look at the gap between the heat we measure and the heat we experience.
We chose to work with four major Indian metros, Delhi, Mumbai, Chennai and Kolkata, a mix of coastal and landlocked cities that experience heat differently. For 2024, the hottest year on record, we used dumbbell charts to visualise the gap between recorded and felt temperatures for every hour of every day. At night, temperatures typically fall as winds shift. But as nights get warmer, that window of relief is shrinking during the summer months.
Some of the widest gaps appear in Delhi during August, when the deviation can be as high as 10.7 °C. In Chennai, recorded temperatures barely crossed 37 °C all year, but it could feel as hot as 46.5 °C.
Degrees apart
The difference between recorded air temperature and felt temperature through the day, in 2024
And because heat unfolds across the year, we started looking for a way to physicalise these patterns. Calendars felt like the natural starting point to see when hot days cluster, when nights stop offering relief, and how heat stretches across the year.
October in Mumbai feels much hotter than records suggest, with 23 days of severe felt heat. In Chennai, the felt heat stretches across eight months of the year, which is nearly three out of every five days a year.
A year of hot days and hot nights
Number of days where days felt hotter and nights warmer
Next, we looked at the hours we lose: when does the heat ease enough to step outside, and how quickly are those windows shrinking?
In the hottest months of the year, the heat is already on by the time the workday begins. In Chennai and Mumbai, people step out into mornings that feel like over 30 °C by 8 AM. In Delhi, heat stress builds by mid-morning and lasts for nearly nine hours. For many, these are the hours spent commuting, working outdoors, and earning a living.
Around the clock
More hours of the day are becoming too hot to step outside
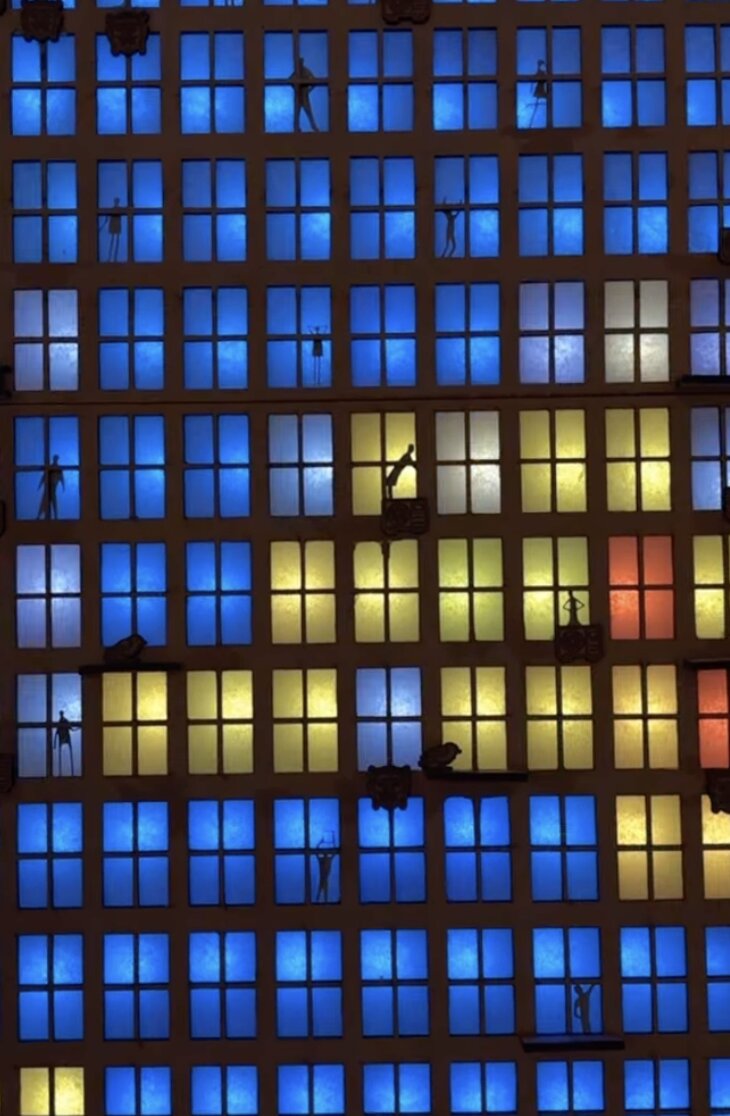
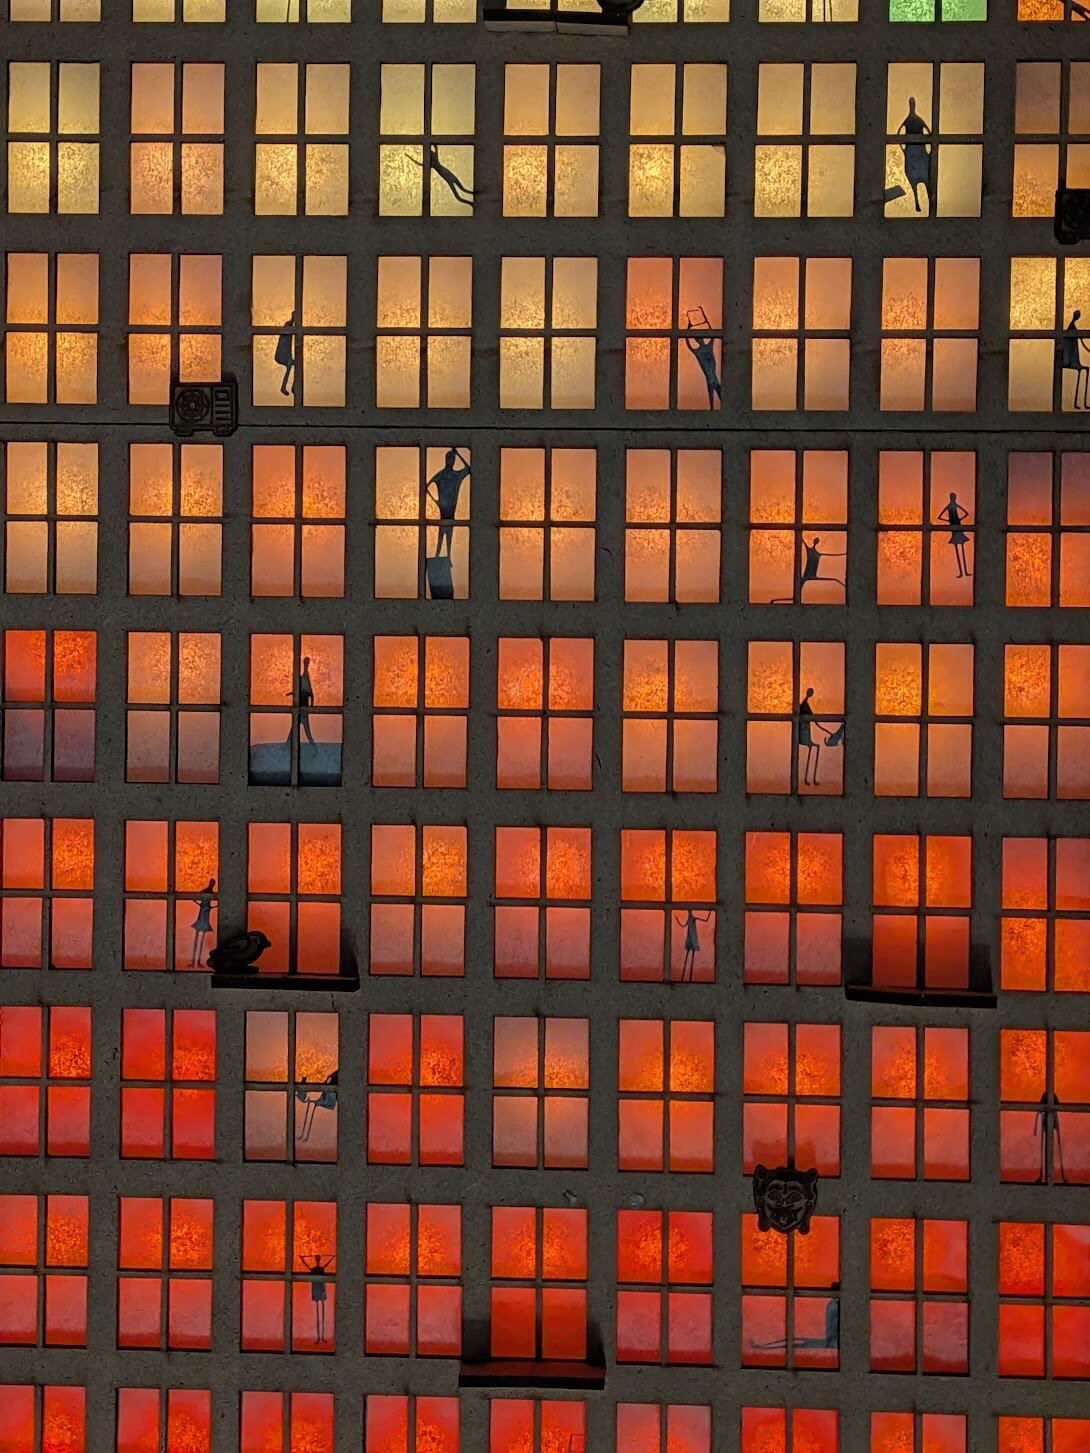
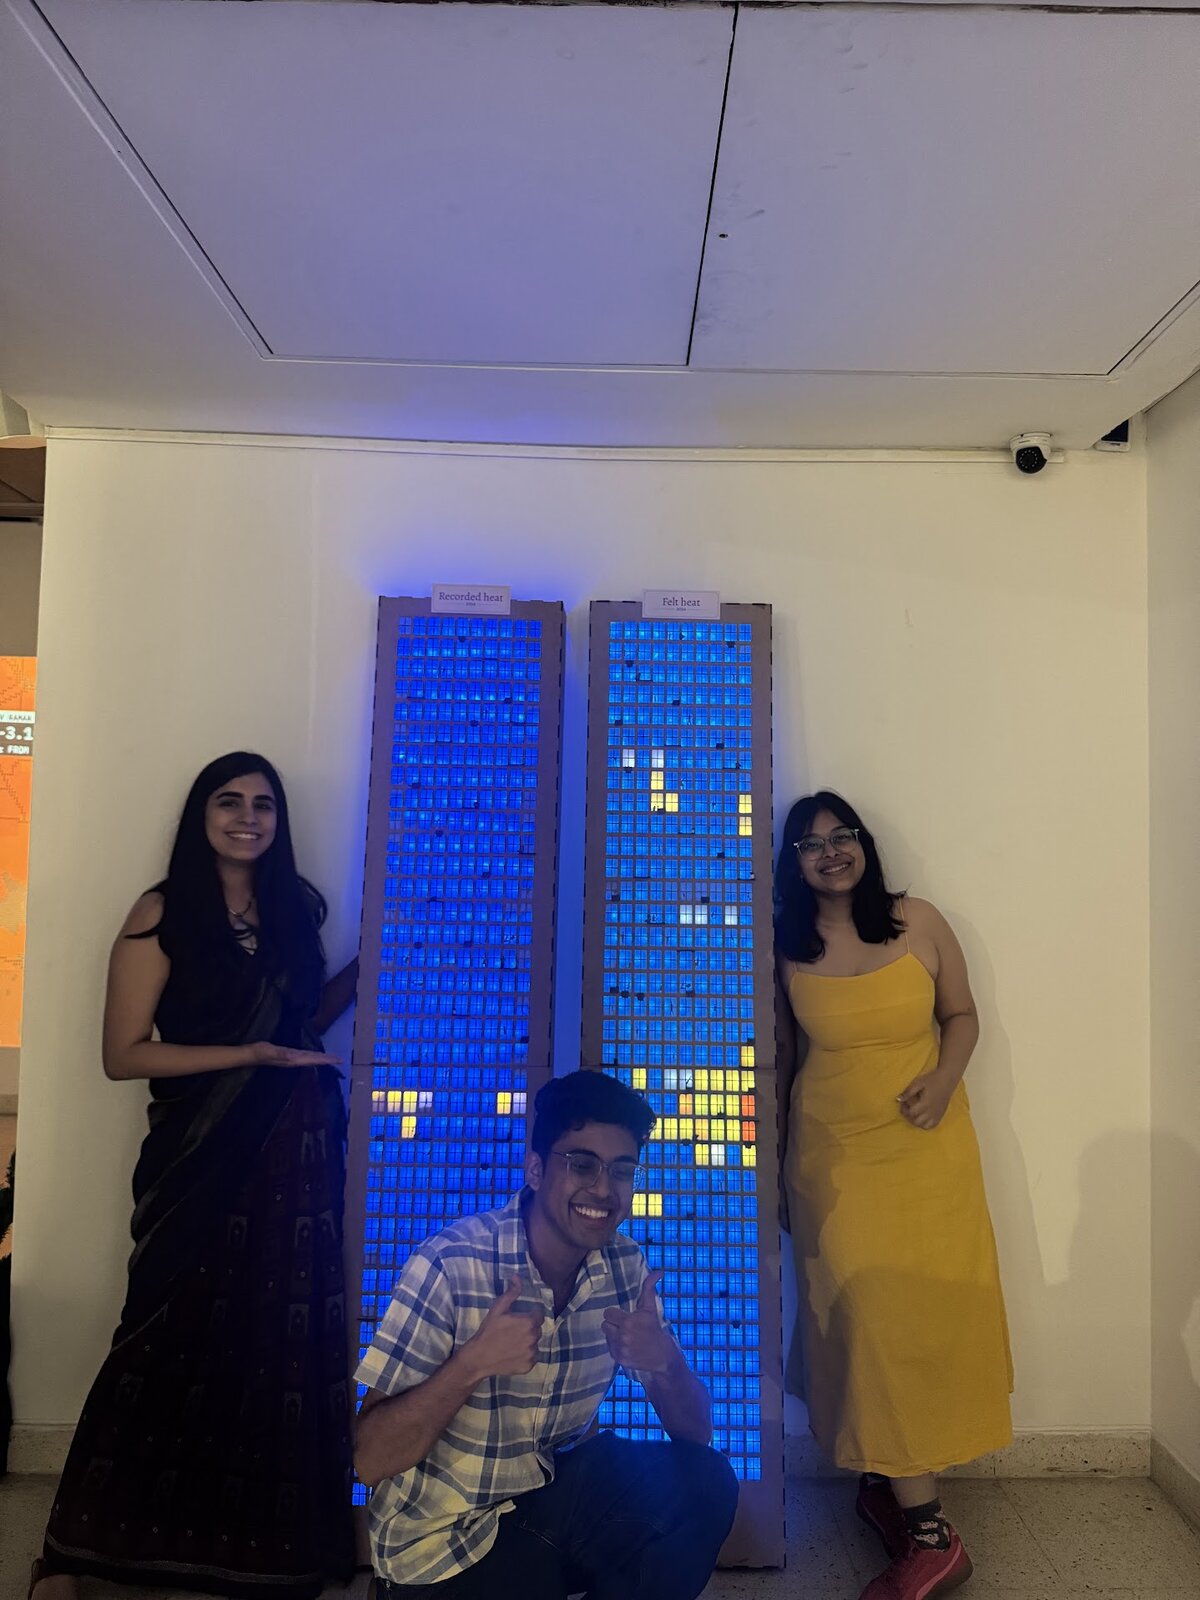
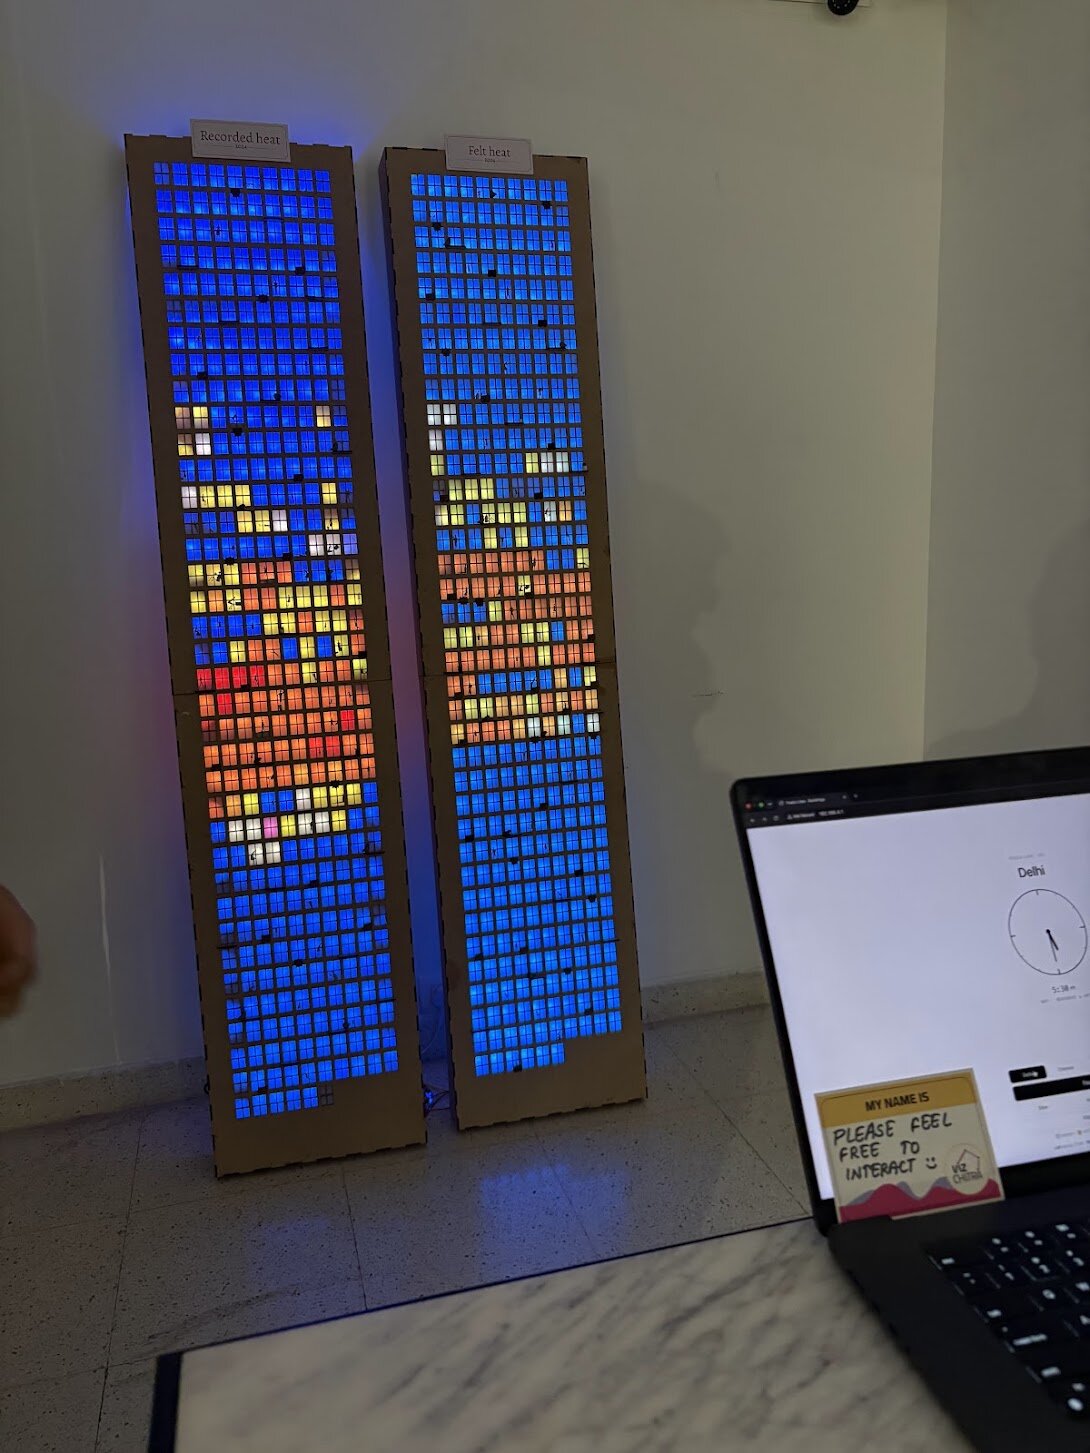
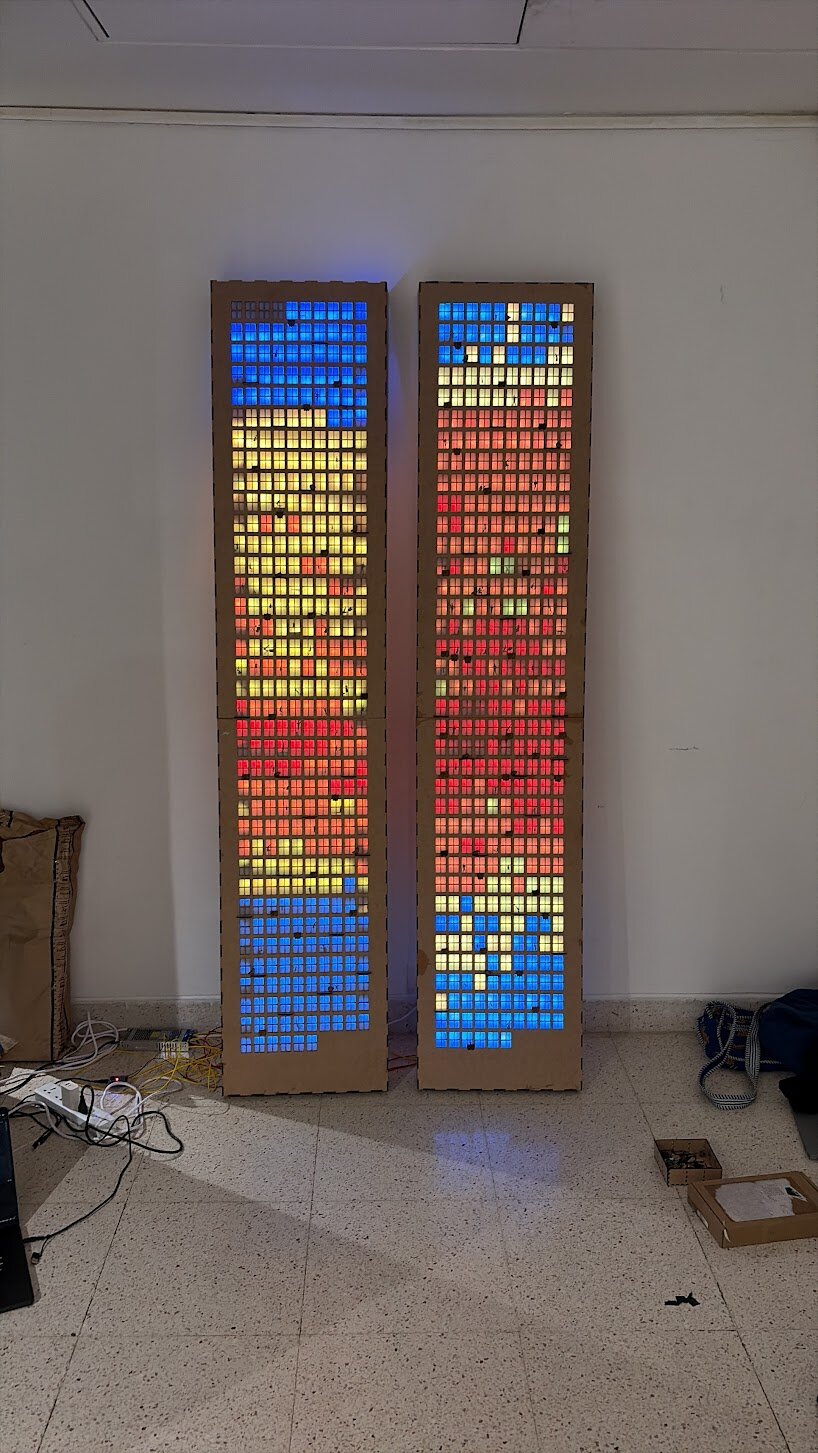
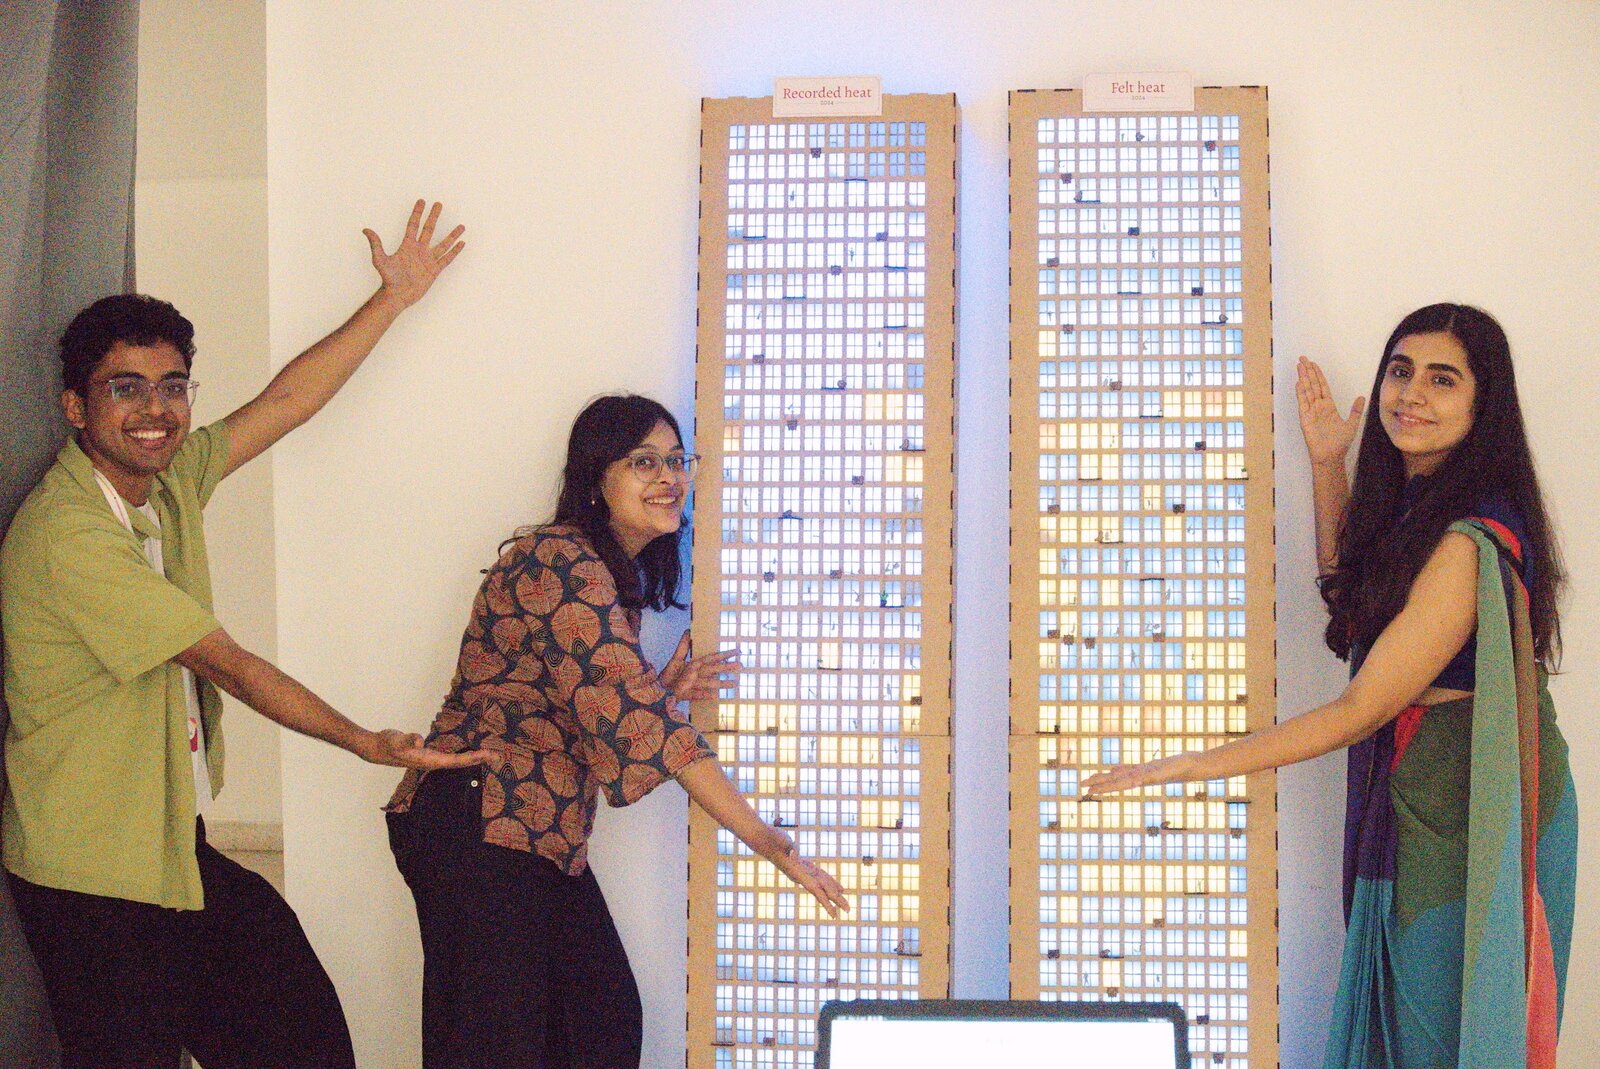
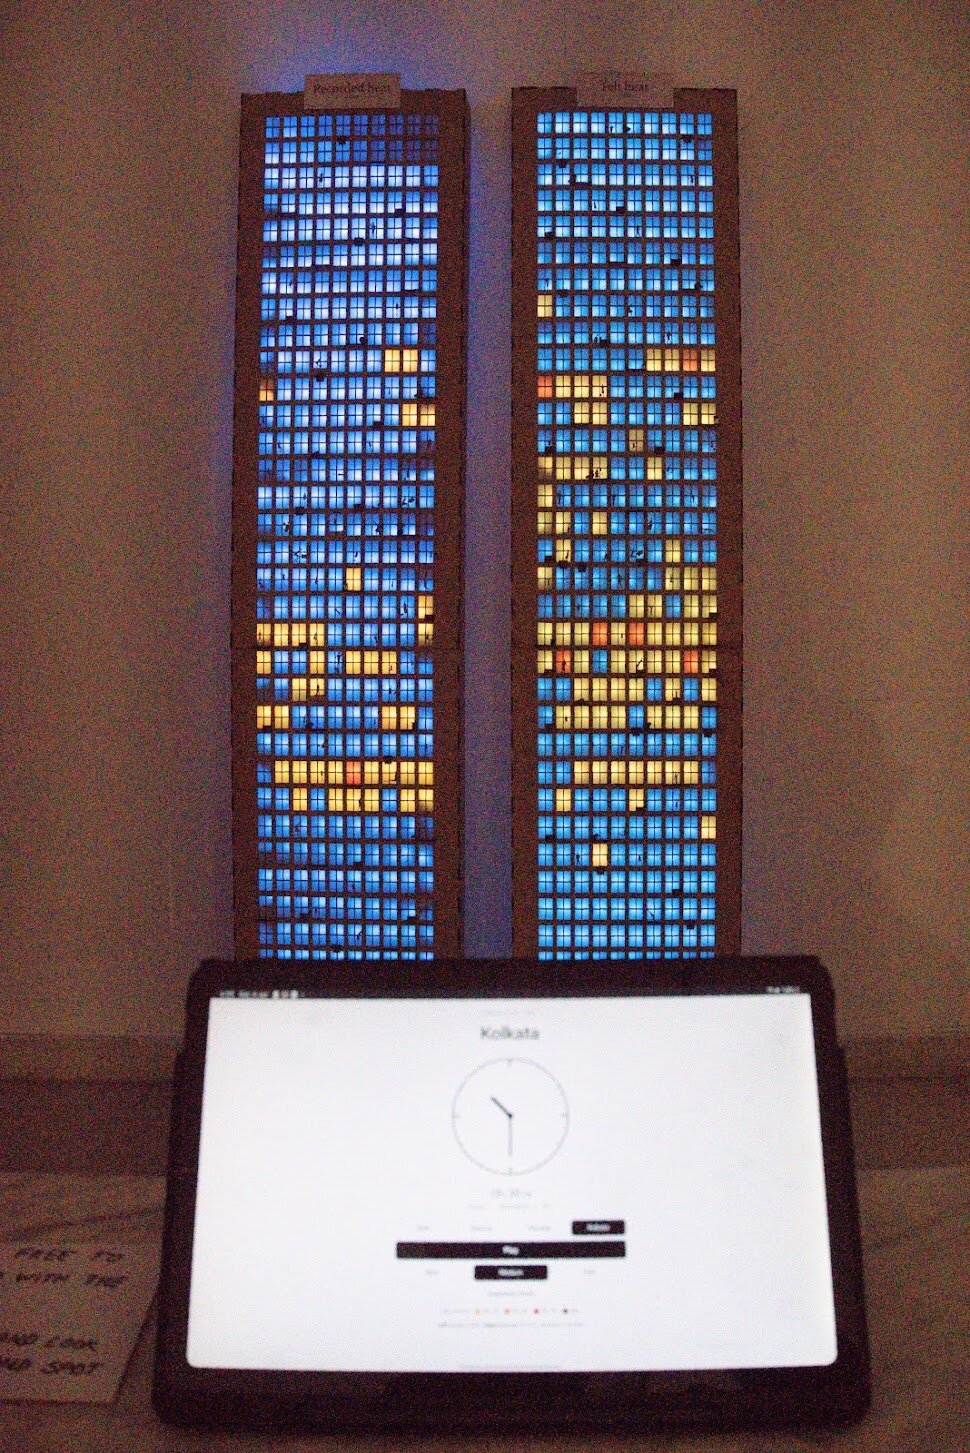
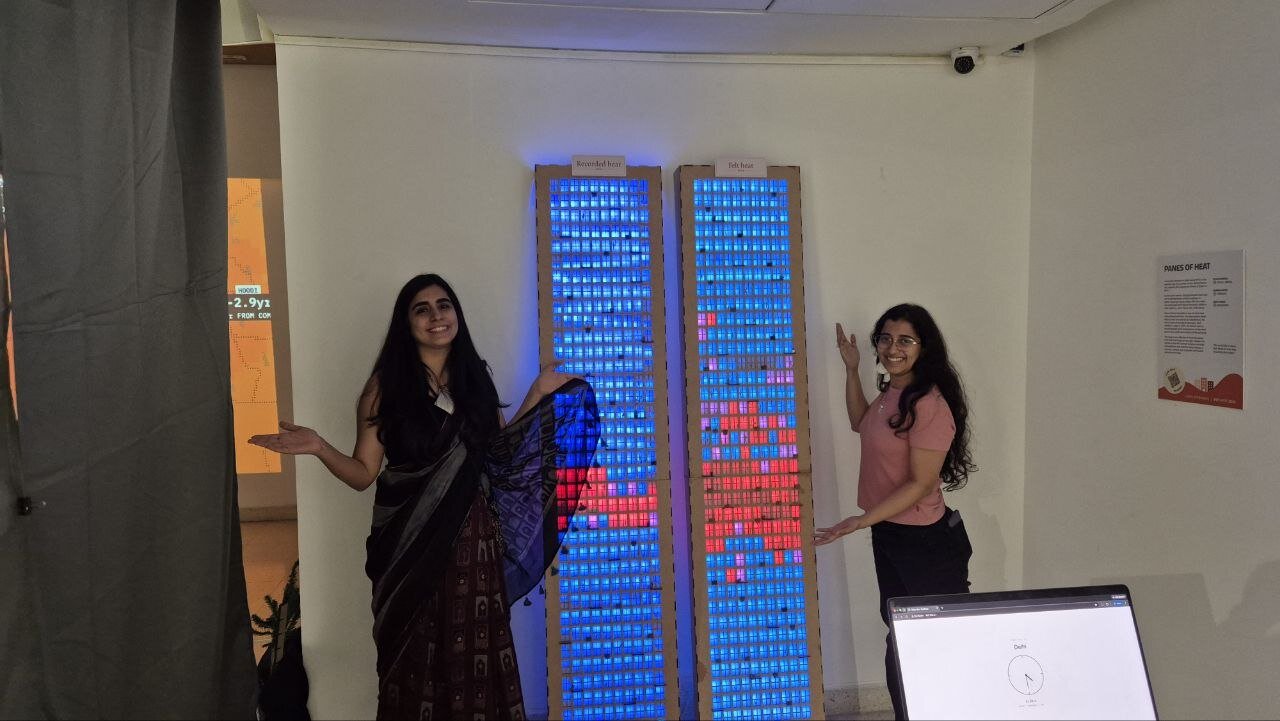
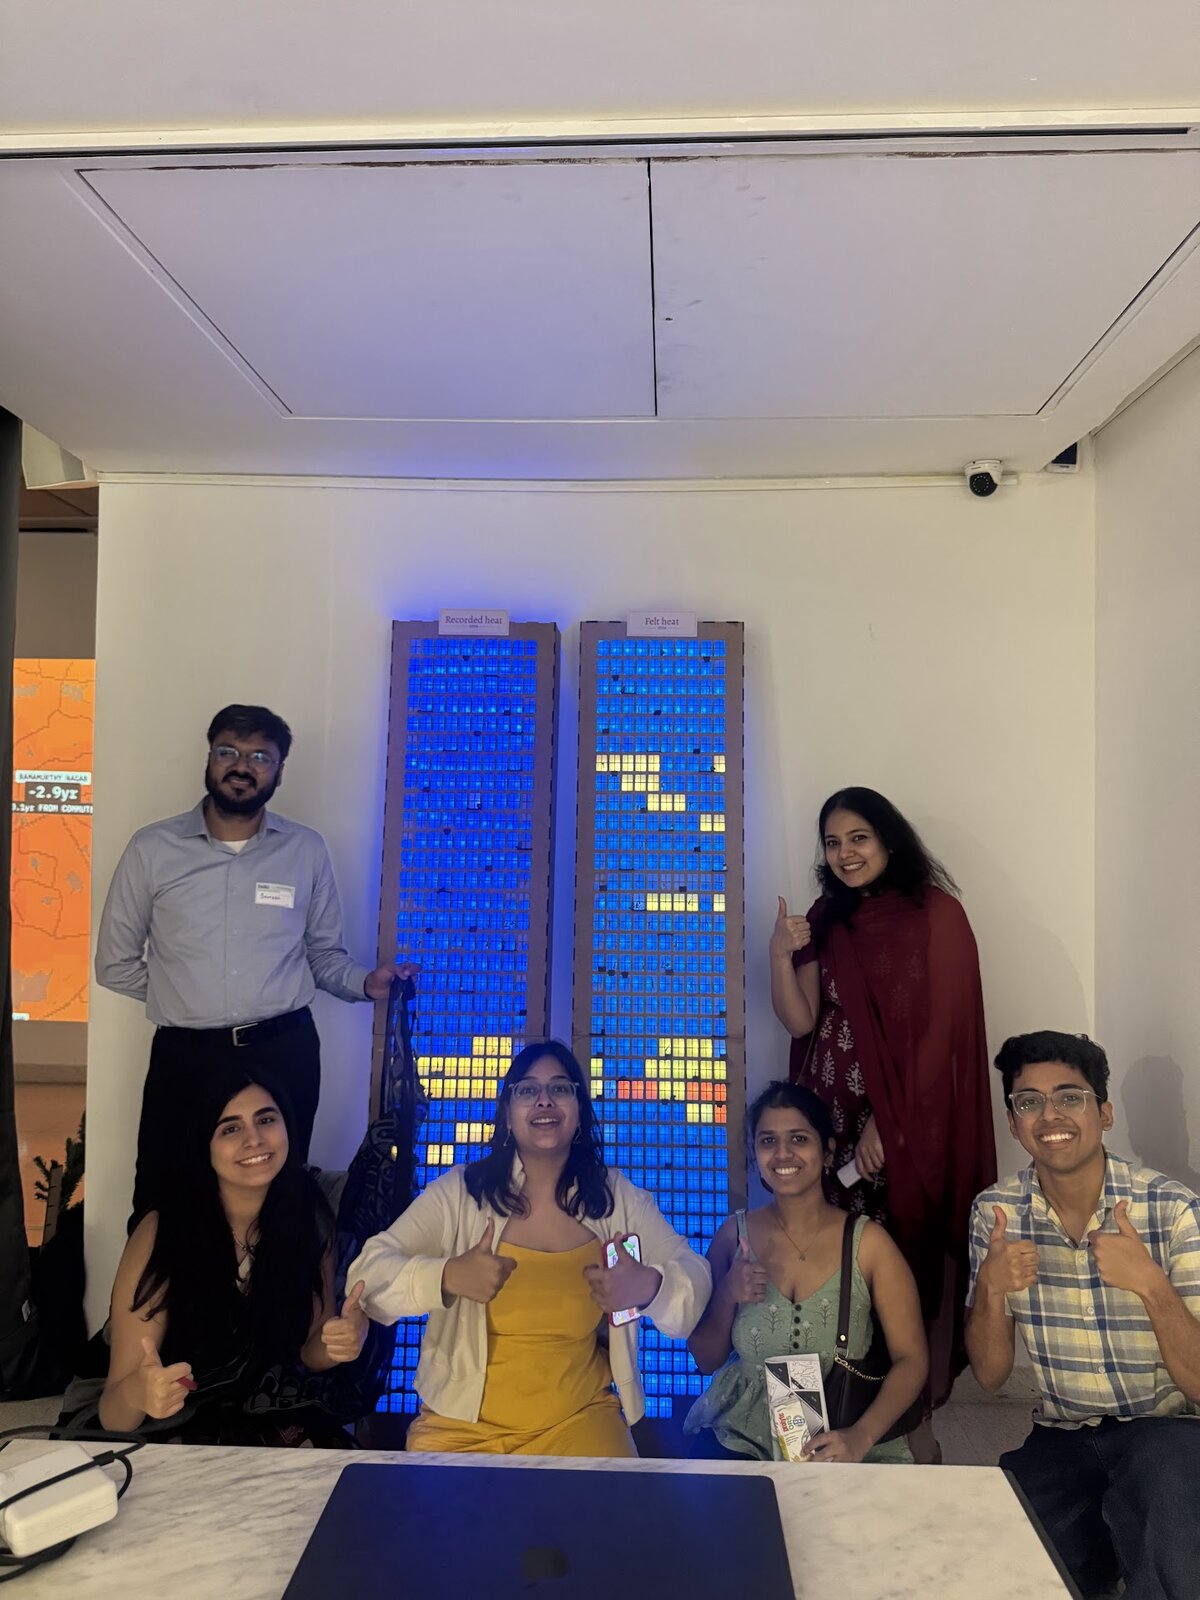
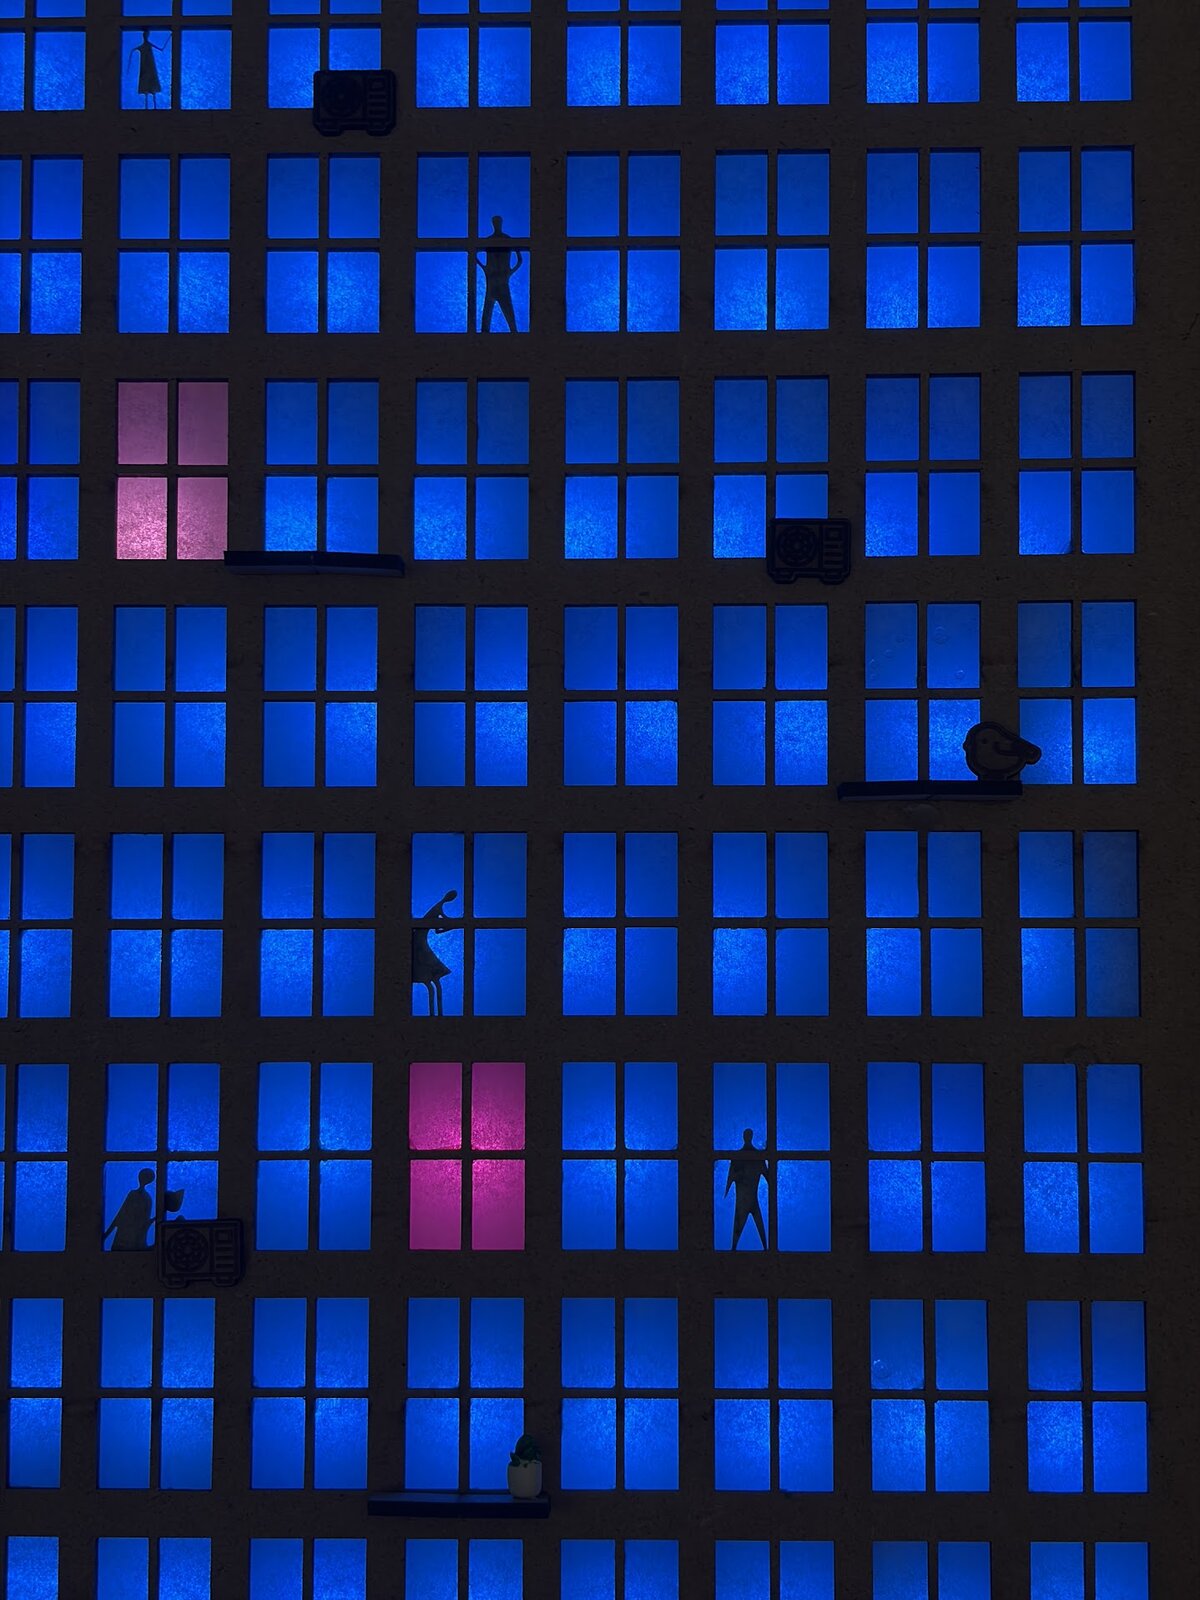
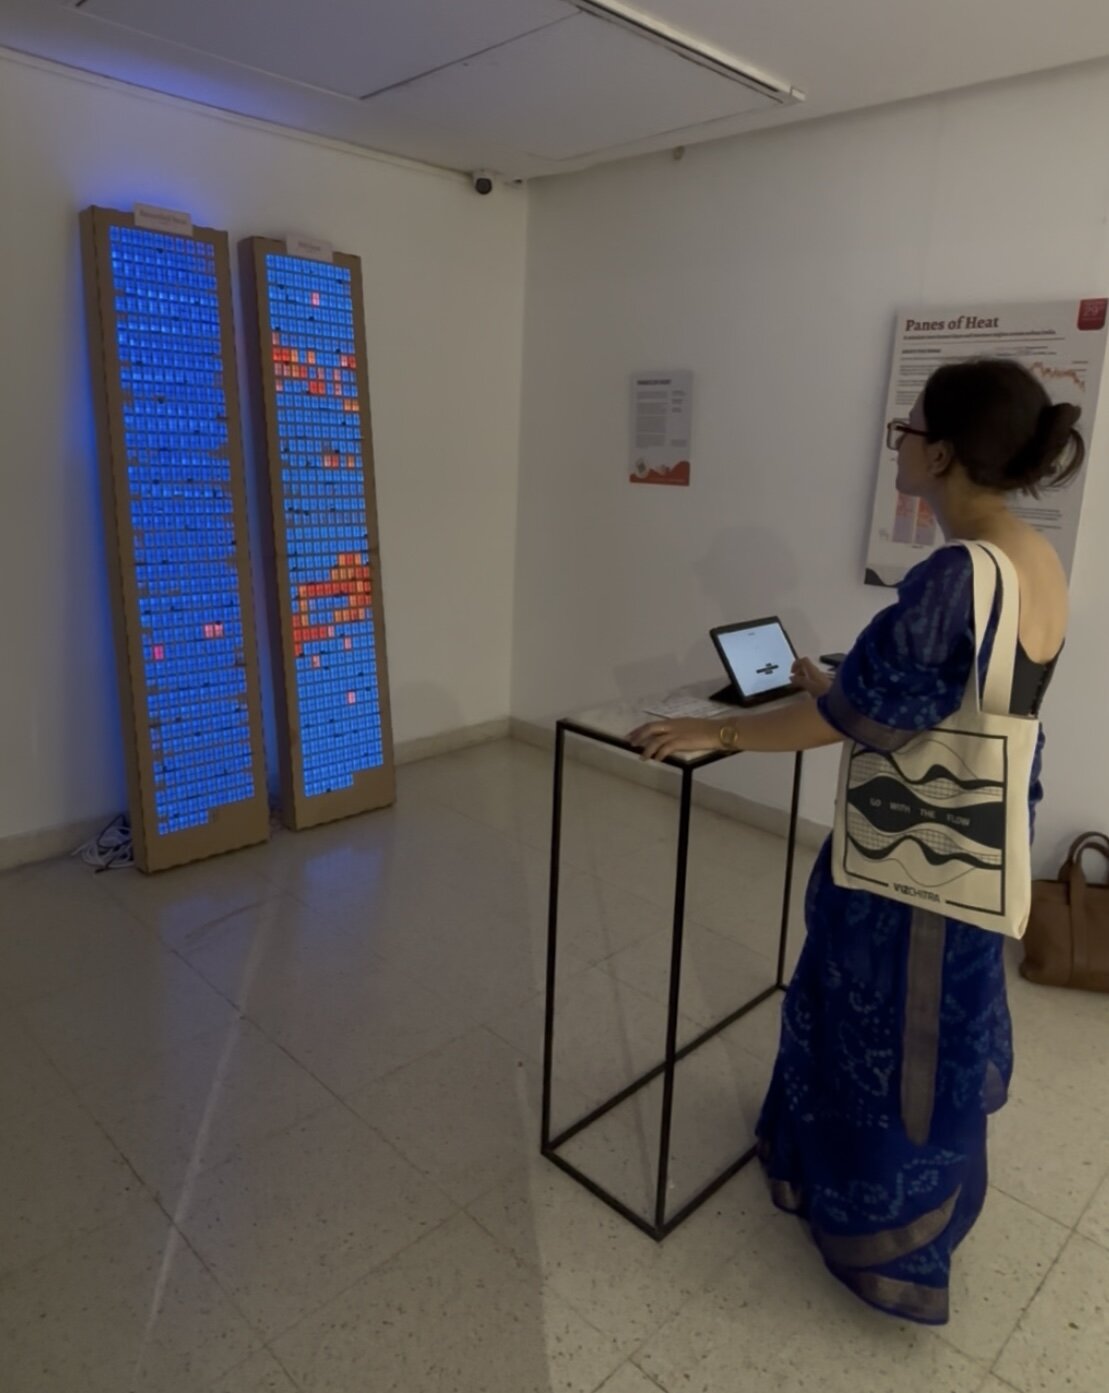
Since we were working with megacities, we wanted the form to reflect them. A skyscraper became our metaphor for the year: the months became floors, from January at the top to December at the bottom, and every window a day in time. The buildings also mirrored dense urban environments that continue to trap and radiate heat long after the sun has set. We digitally prototyped a pair of buildings, one visualising recorded temperatures, the other visualising felt heat.
Windows of discomfort
Bringing together our insights on how people in India's biggest cities experience heat
A Paneful Experience
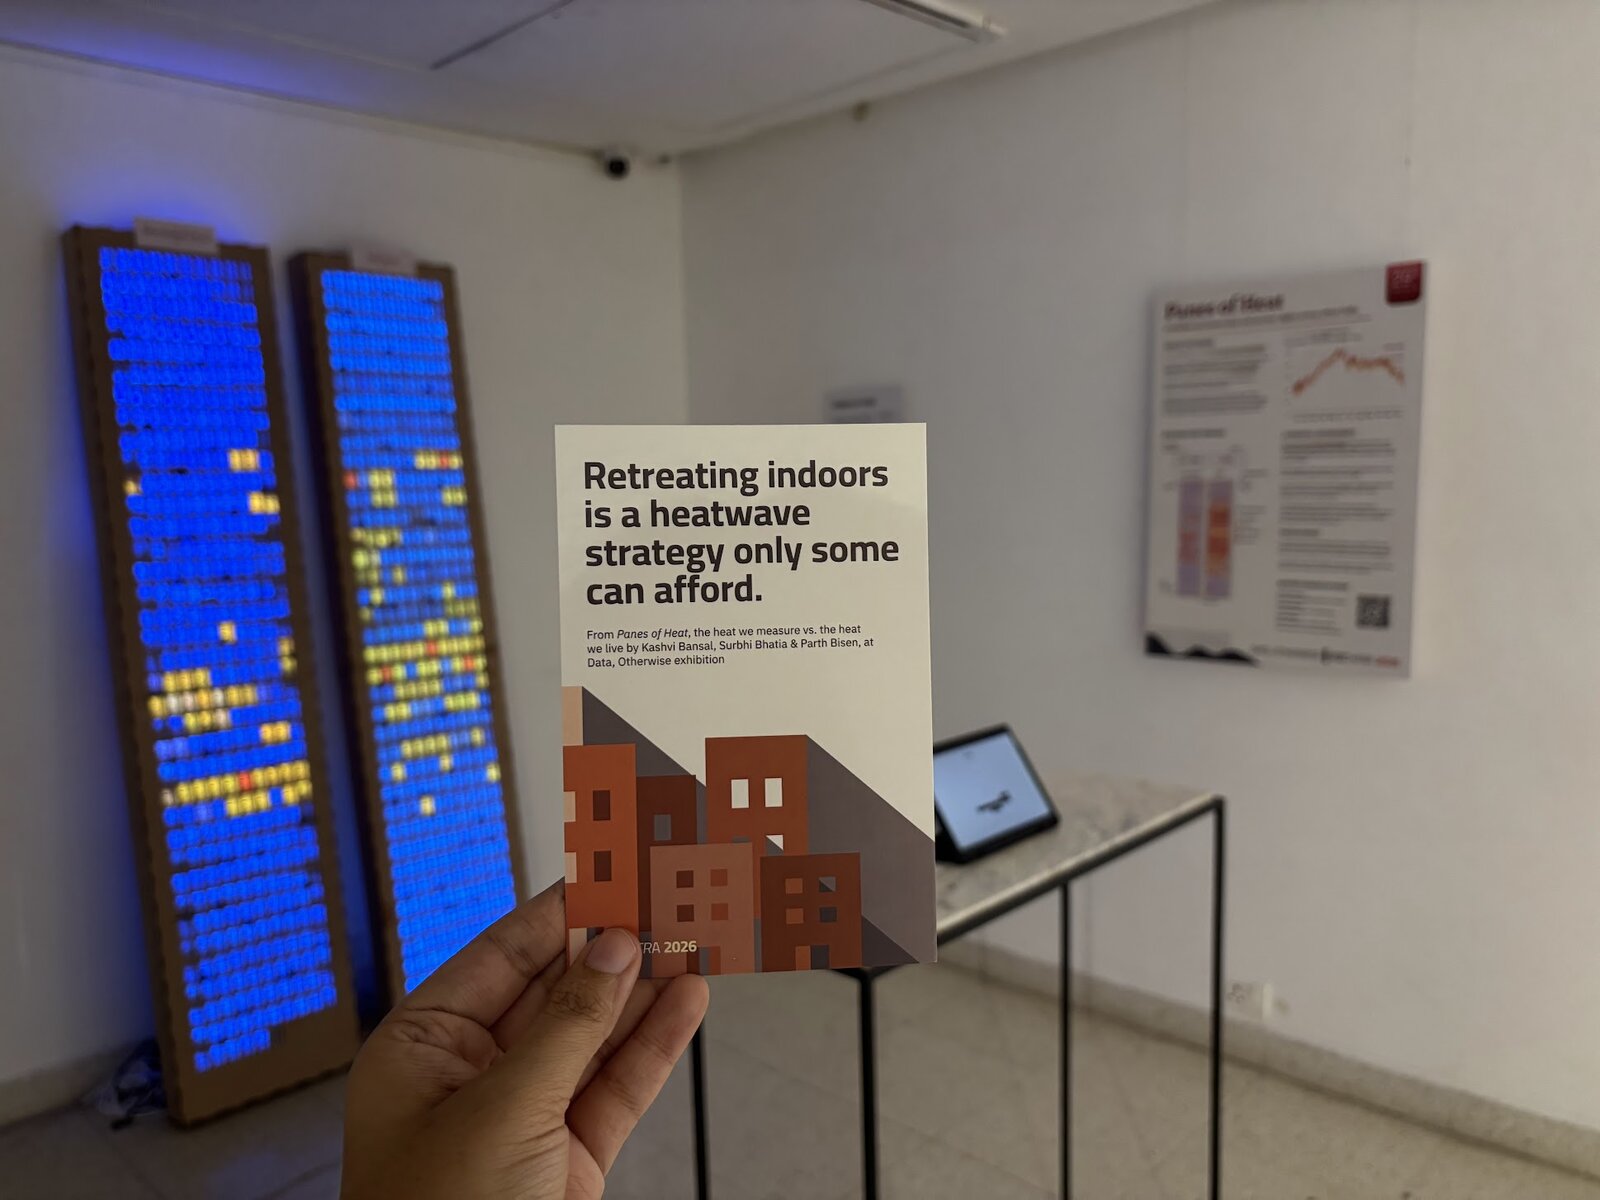
Behind Panes of Heat
The Question
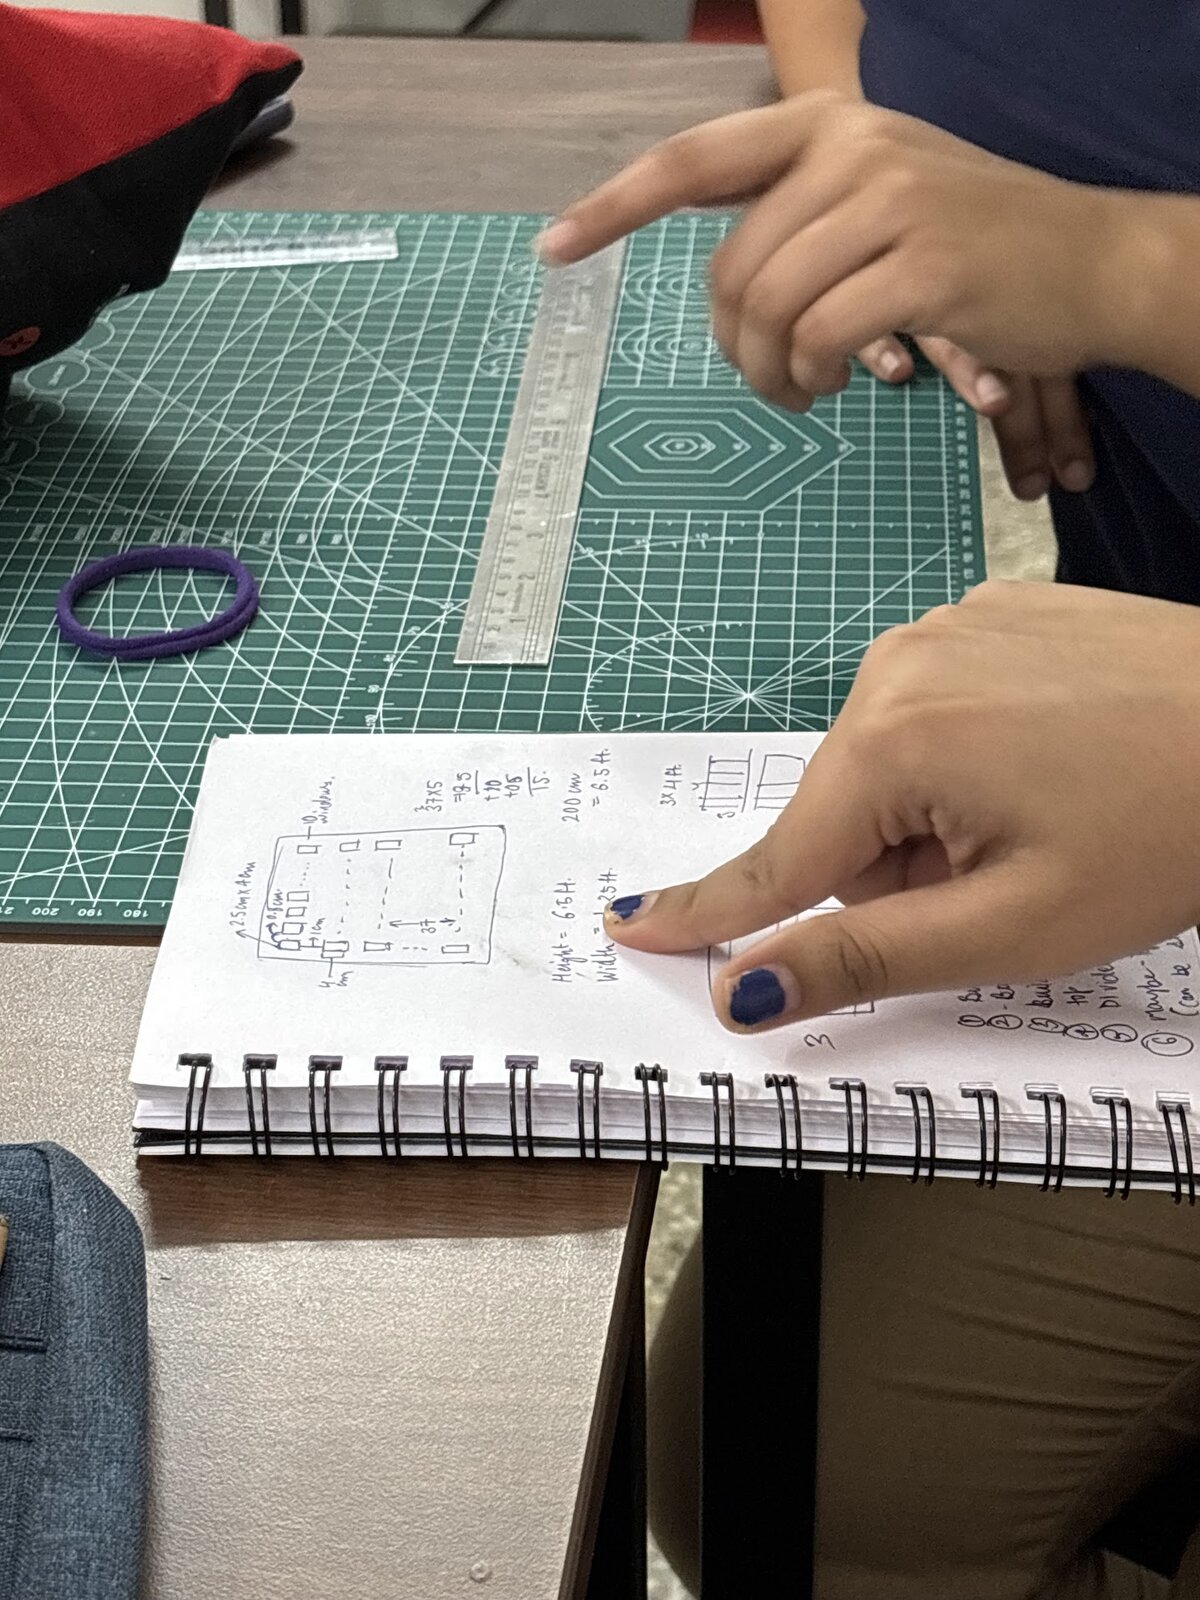
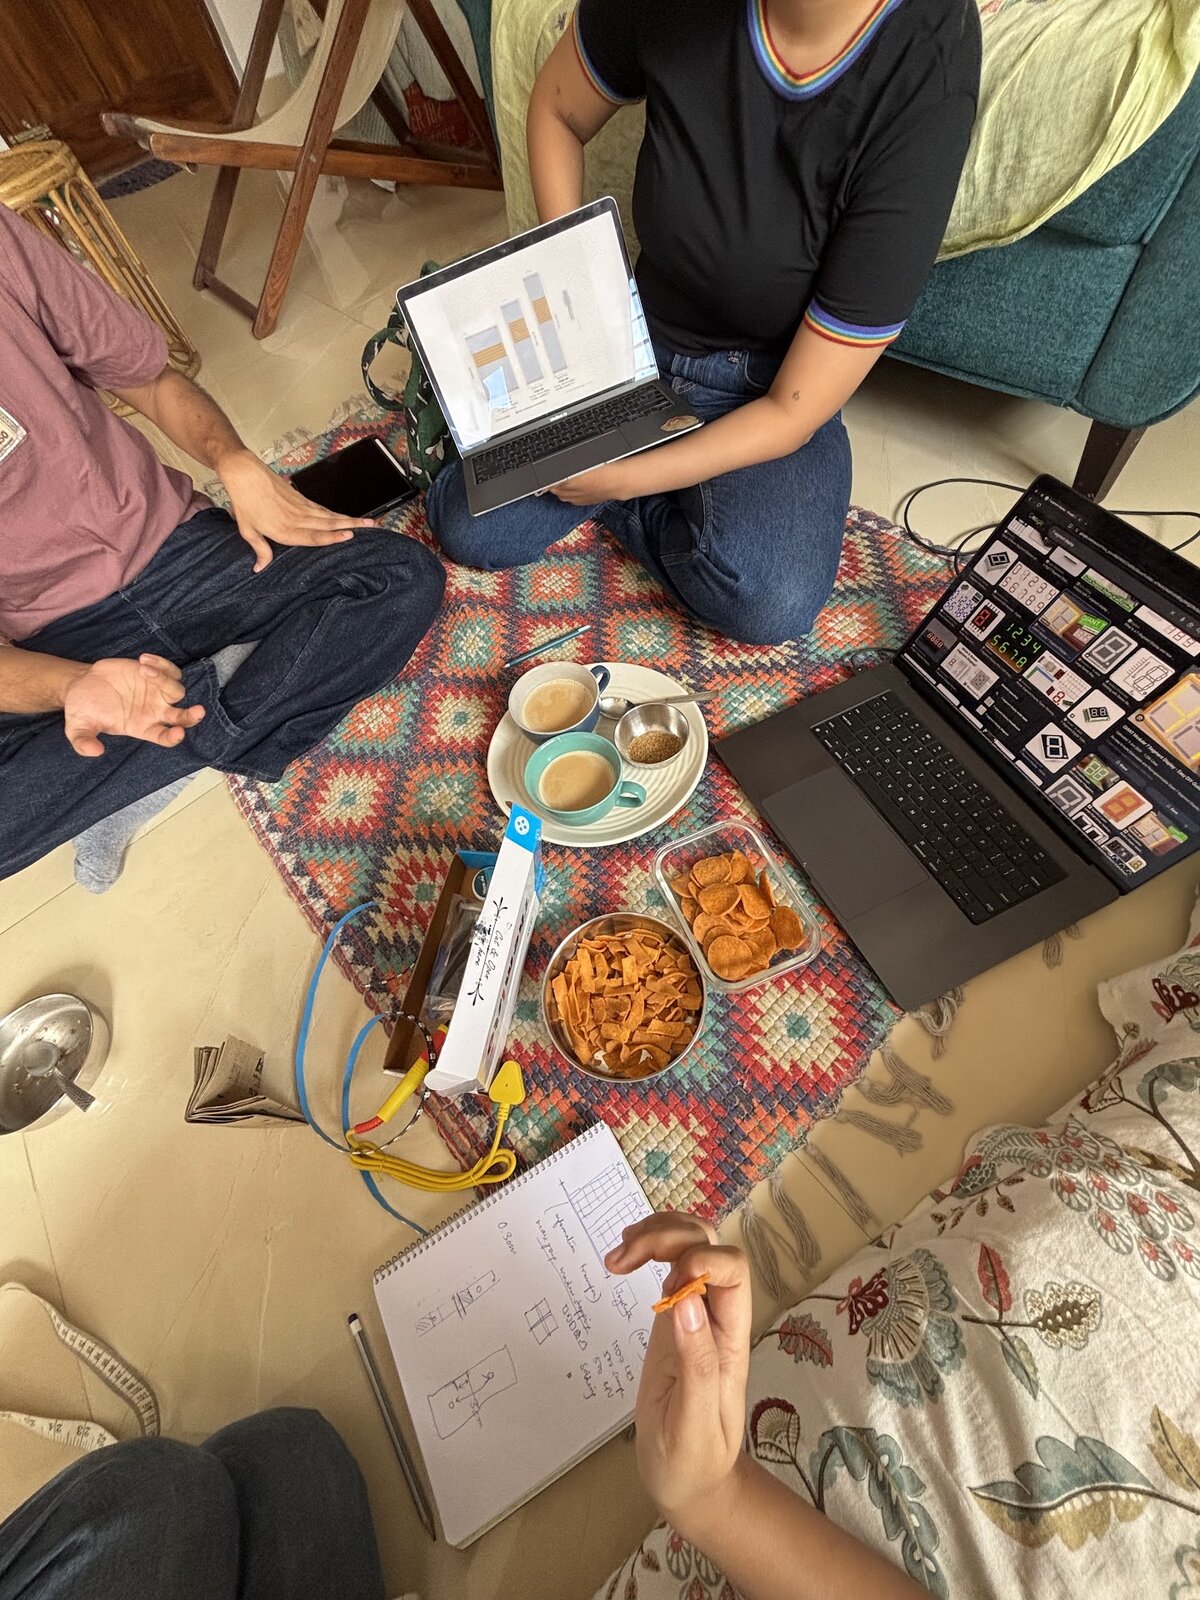
Making heat visible is tricky. How do you materialise it? How do you make people feel it? Turning the room up to 45 °C was not a practical option. So we started with paper and pen, exploring the forms it could take to evoke the experience of heat.
The Mechanics
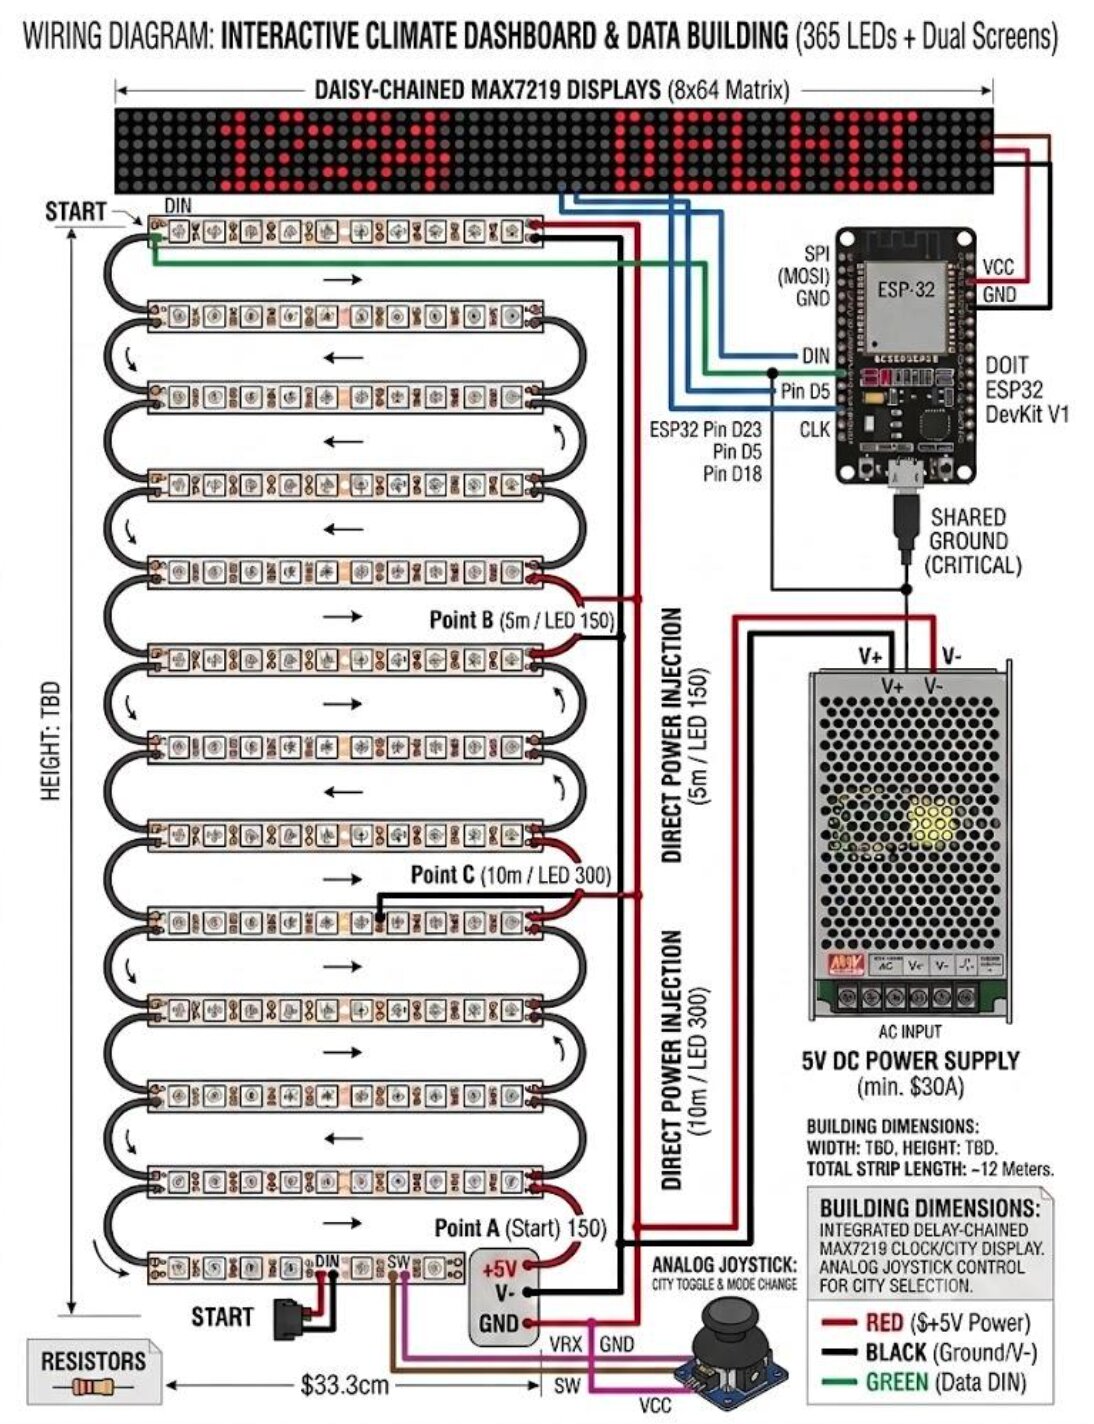
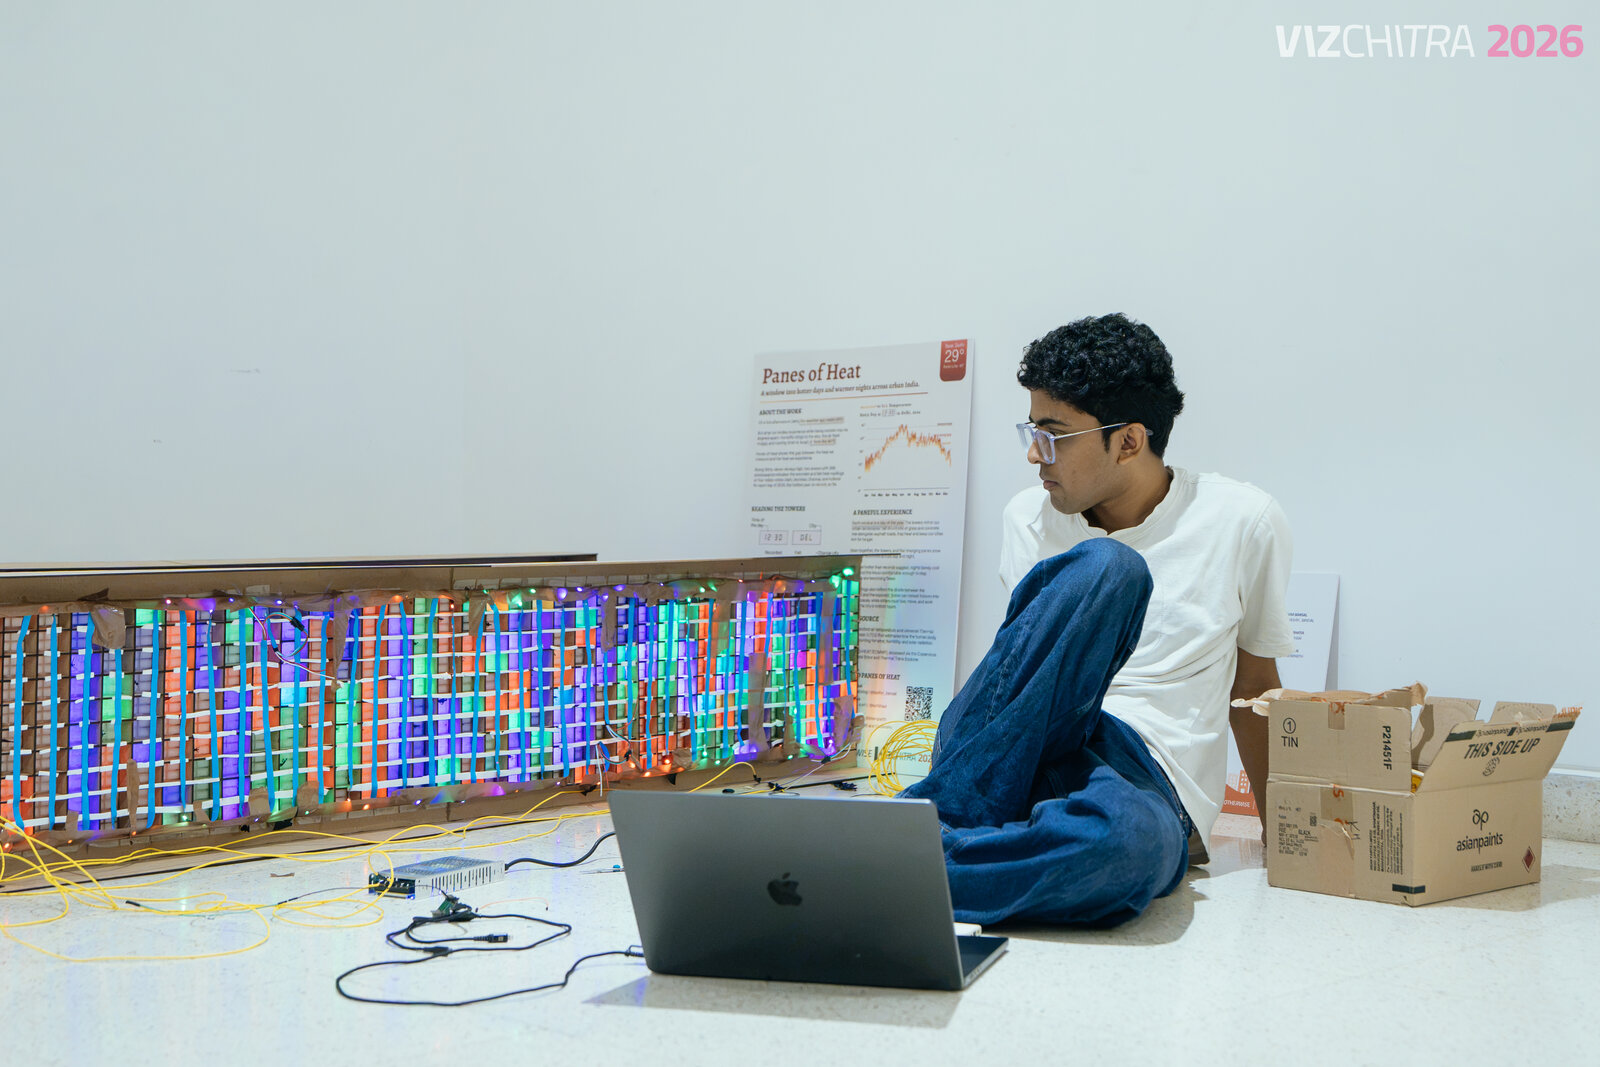
Before we could build anything, we had to figure out how data would inhabit a physical object. We mapped the electronics, planned the wiring, worked out how light would travel through the towers, and designed a structure where every window could glow independently.
The Material
Turning the concept into a real object involved solving many, many design problems. We experimented with acrylic, paper, paints, lighting, electronics, and adhesives, refining the build until every window lit up evenly, without light bleeding into the next. Along the way, we developed strong opinions about adhesives: Fevicol over Feviquick, and Metlok 743 wherever the towers needed extra strength.
| Component | What it does |
|---|---|
| ESP32 Development Board (link) | This microcontroller is the brain of the installation. It reads the data and controls the lights and displays. |
| WS2812B Addressable RGB LED Strips (link) | Individually programmable LEDs that light up each window based on the data. |
| 5V 30A Switching Power Supply | Powers hundreds of LEDs and the electronics safely and consistently. |
| Heavy-gauge power wire | Carries power across the towers without voltage drop. |
| Female-to-female jumper wires (link) | Connect the controller, displays, and LED strips together. |
| Parchment paper | Diffuses the LED light behind each window so every pane glows evenly. |
| MDF laser-cut body (3.1 mm) | Forms the tower structure, the facades, floors, and slotted dividers behind every window. |
| Metlok 743 bonding adhesive (link) | Bonds the MDF pieces together, holding the tower structure firmly in place. |
… and then we went window shopping.
The Build
We started with small prototypes. Before committing to a six-foot tower, we built one window, then one column, then one strip of light.
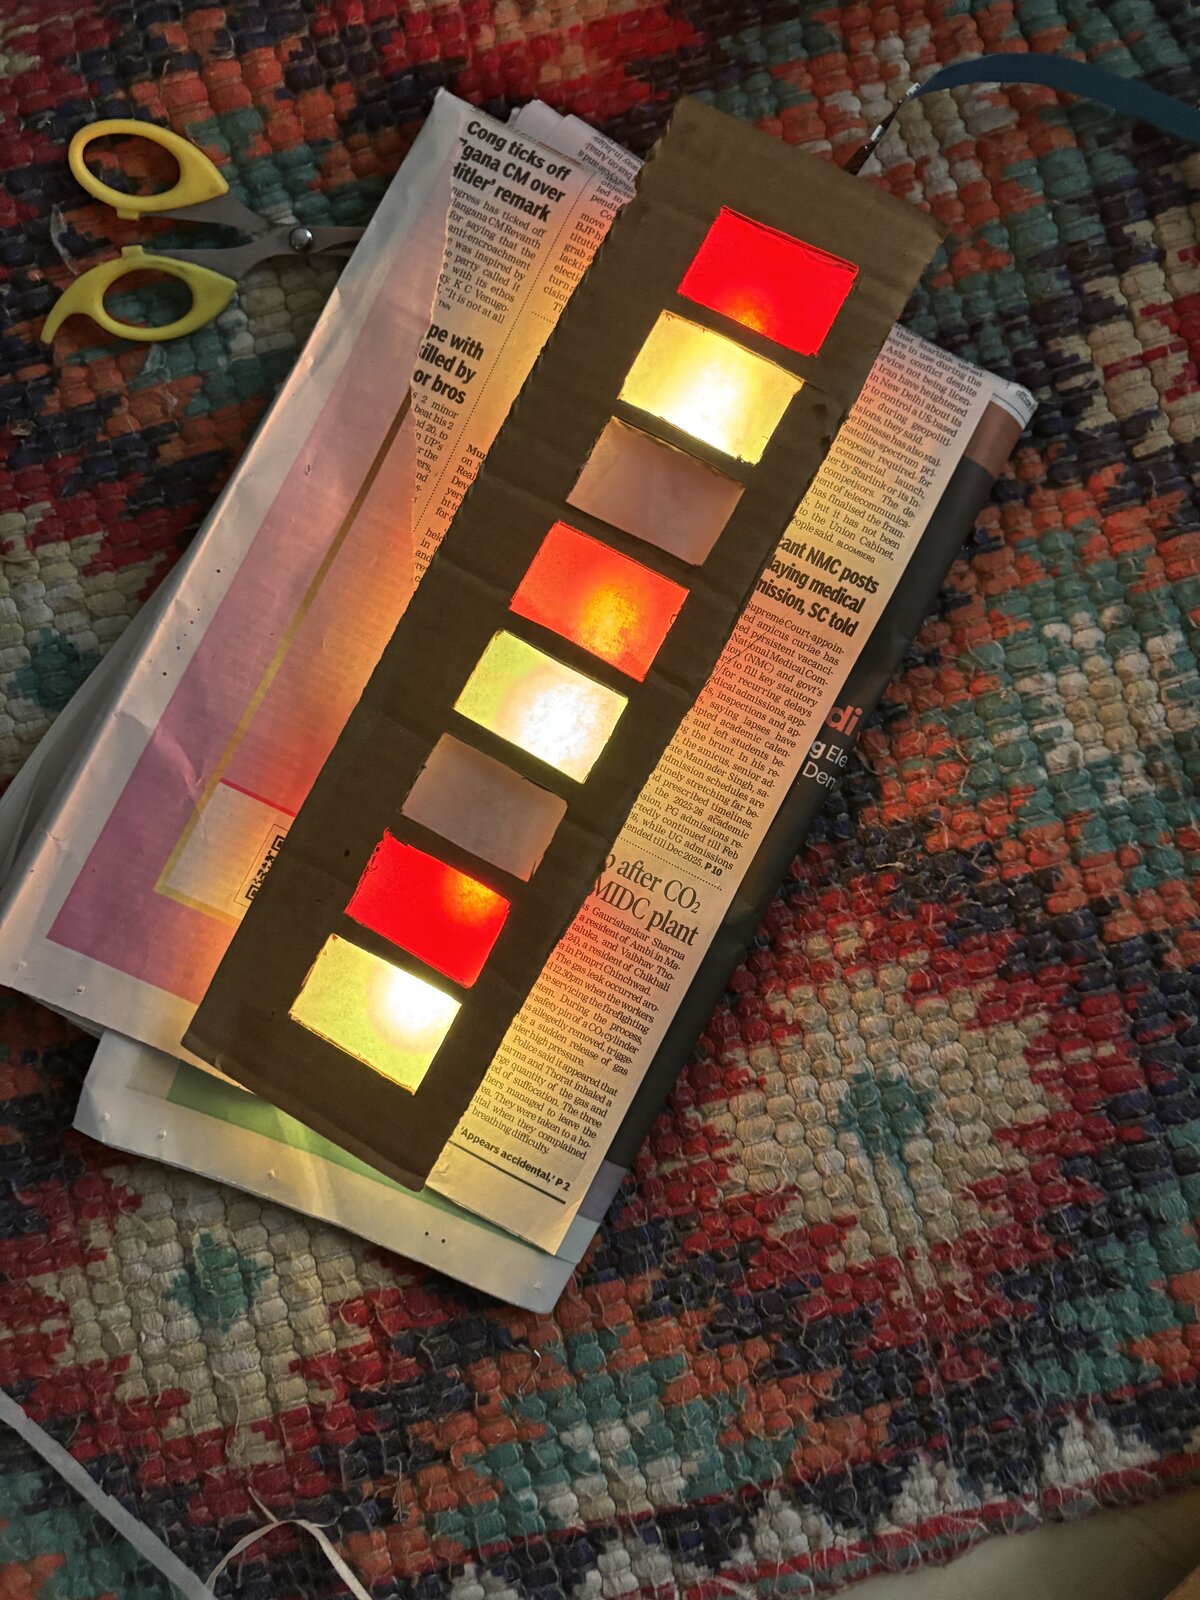
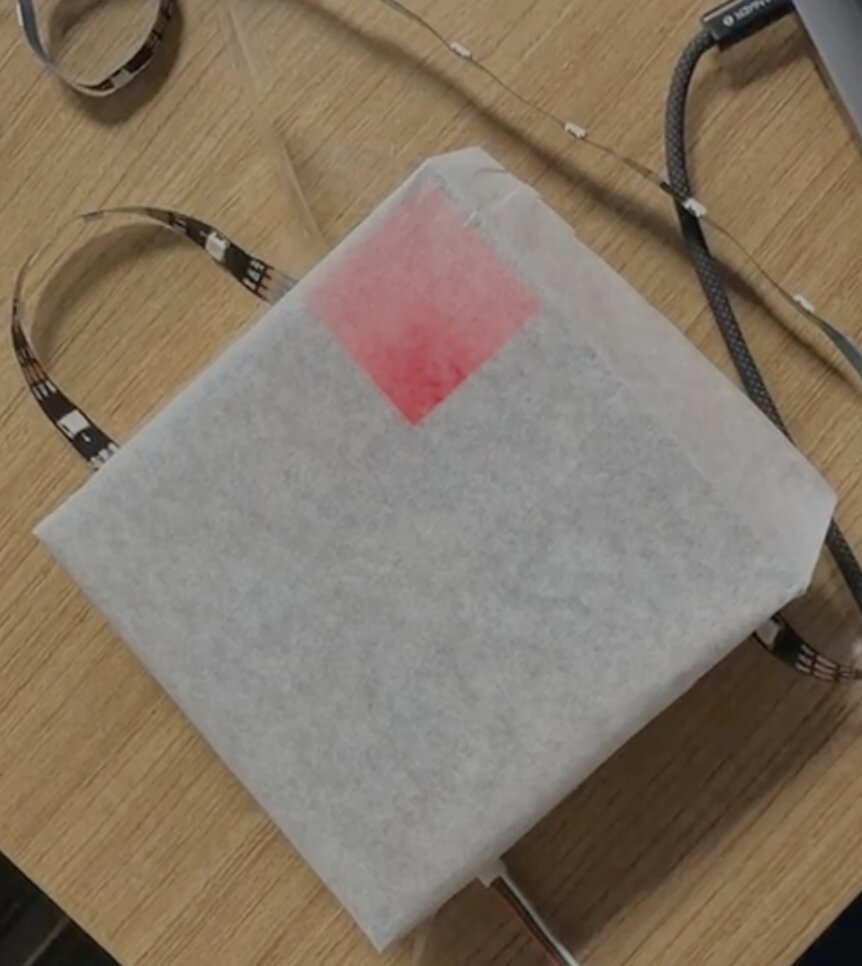
The next challenge was designing the skeleton of the tower. Every laser-cut MDF panel had to interlock precisely, with slots for structural supports, internal dividers, wiring, and LEDs, all while keeping each window isolated from the next.
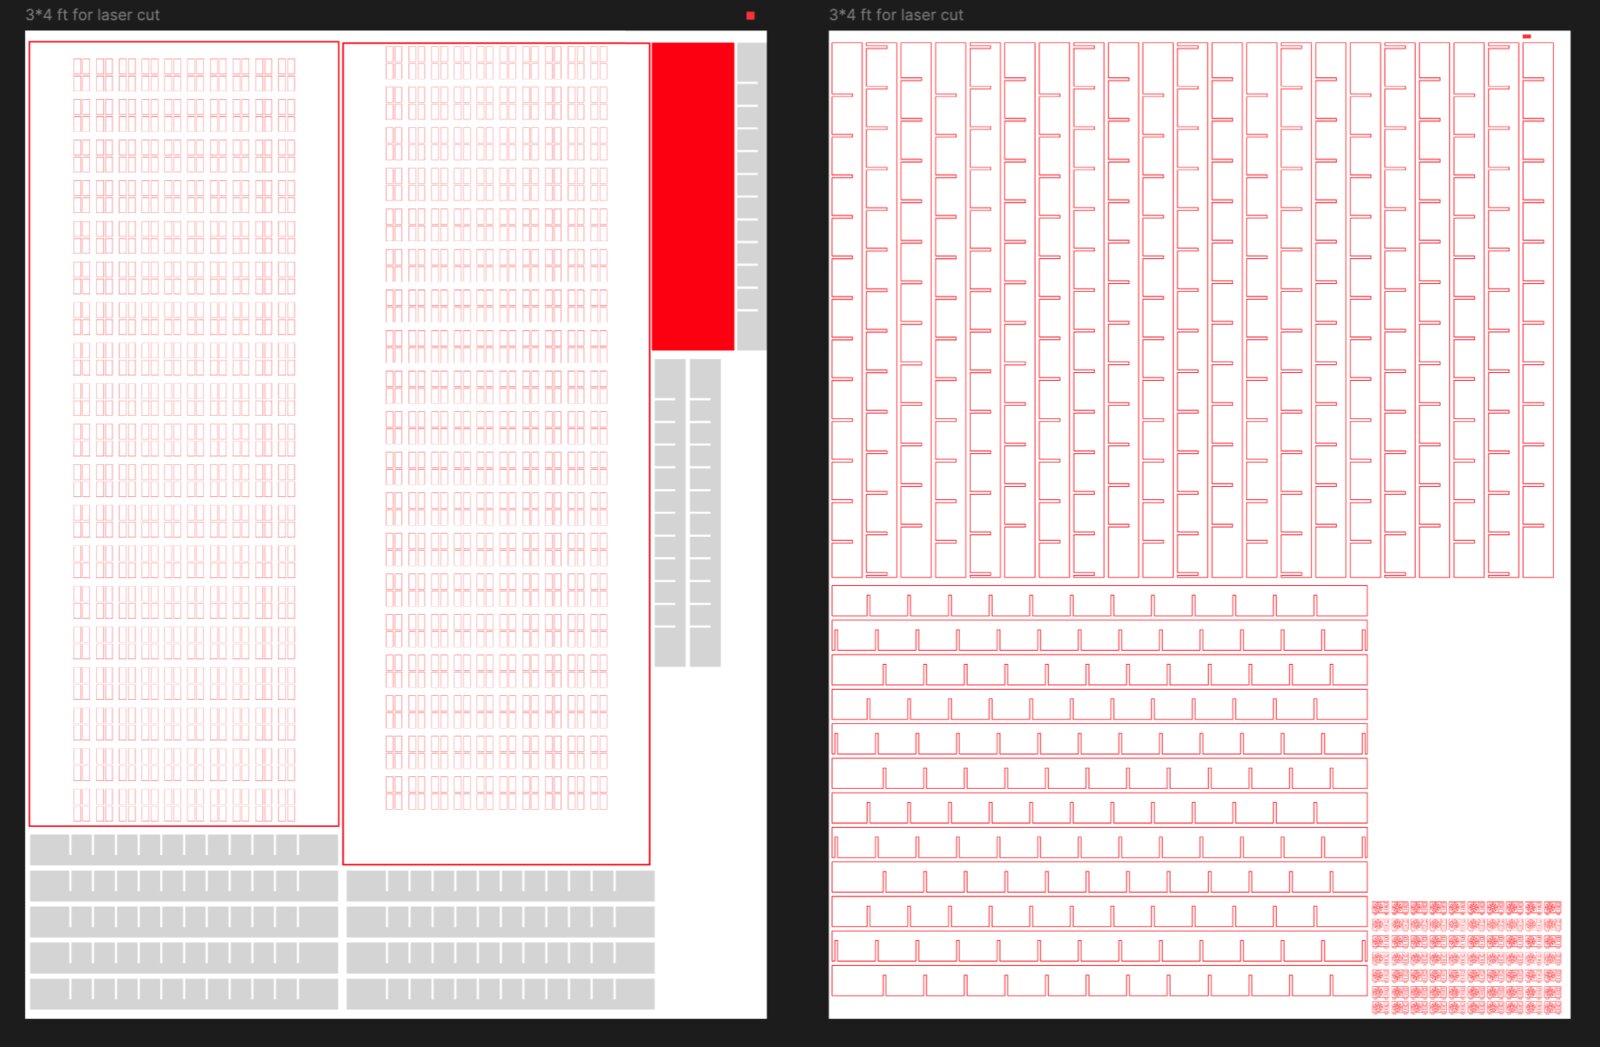
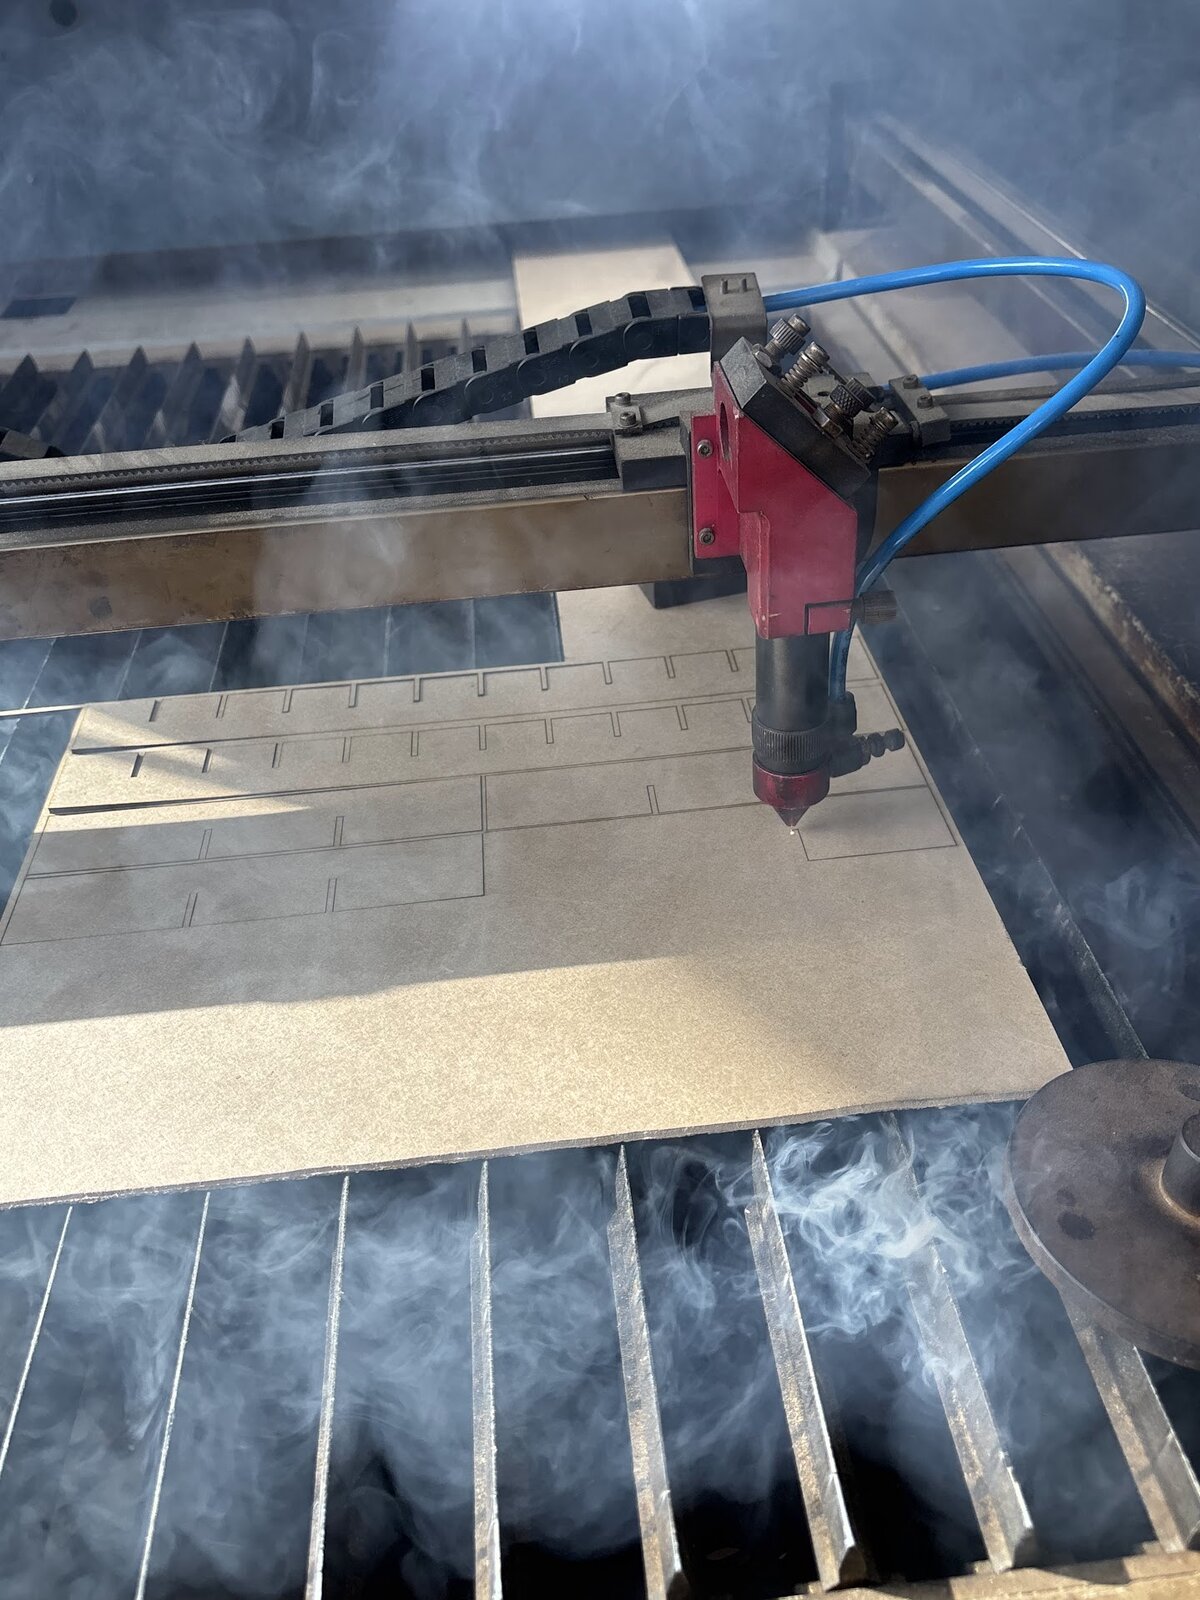
The build became an assembling task once the parts were cut. Three hundred and sixty-six windows were assembled by hand for each tower.
The Code
Just as pipelines and electrical conduits carry water and electricity through a building, ours carried data.
Hourly temperature records travelled from a csv into Arduino code, written in C++ using Adafruit libraries for controlling NeoPixel LEDs. The ESP32 acted like the building’s electrical panel, distributing instructions to hundreds of NeoPixel LEDs so each window knew exactly when to glow and what colour to become.
The data pipeline looked like this: Temperature data → C++ Arduino code → ESP32 microcontroller → NeoPixel LEDs → Window panes.
The Human Layer
A tower of numbers is still just a tower of numbers. We wanted visitors to imagine the people behind every glowing window: someone trying to sleep through a hot night, someone leaving home before sunrise for work, someone opening a window that offers no relief. The tiny silhouettes became our residents, giving the towers a life beyond the data.


Thank you for engaging with our work at Data, Otherwise, VizChitra 2026.

Curators & Mentors: Debanshu Bhaumik, Siddhartha Mukherjee, Amit Kapoor
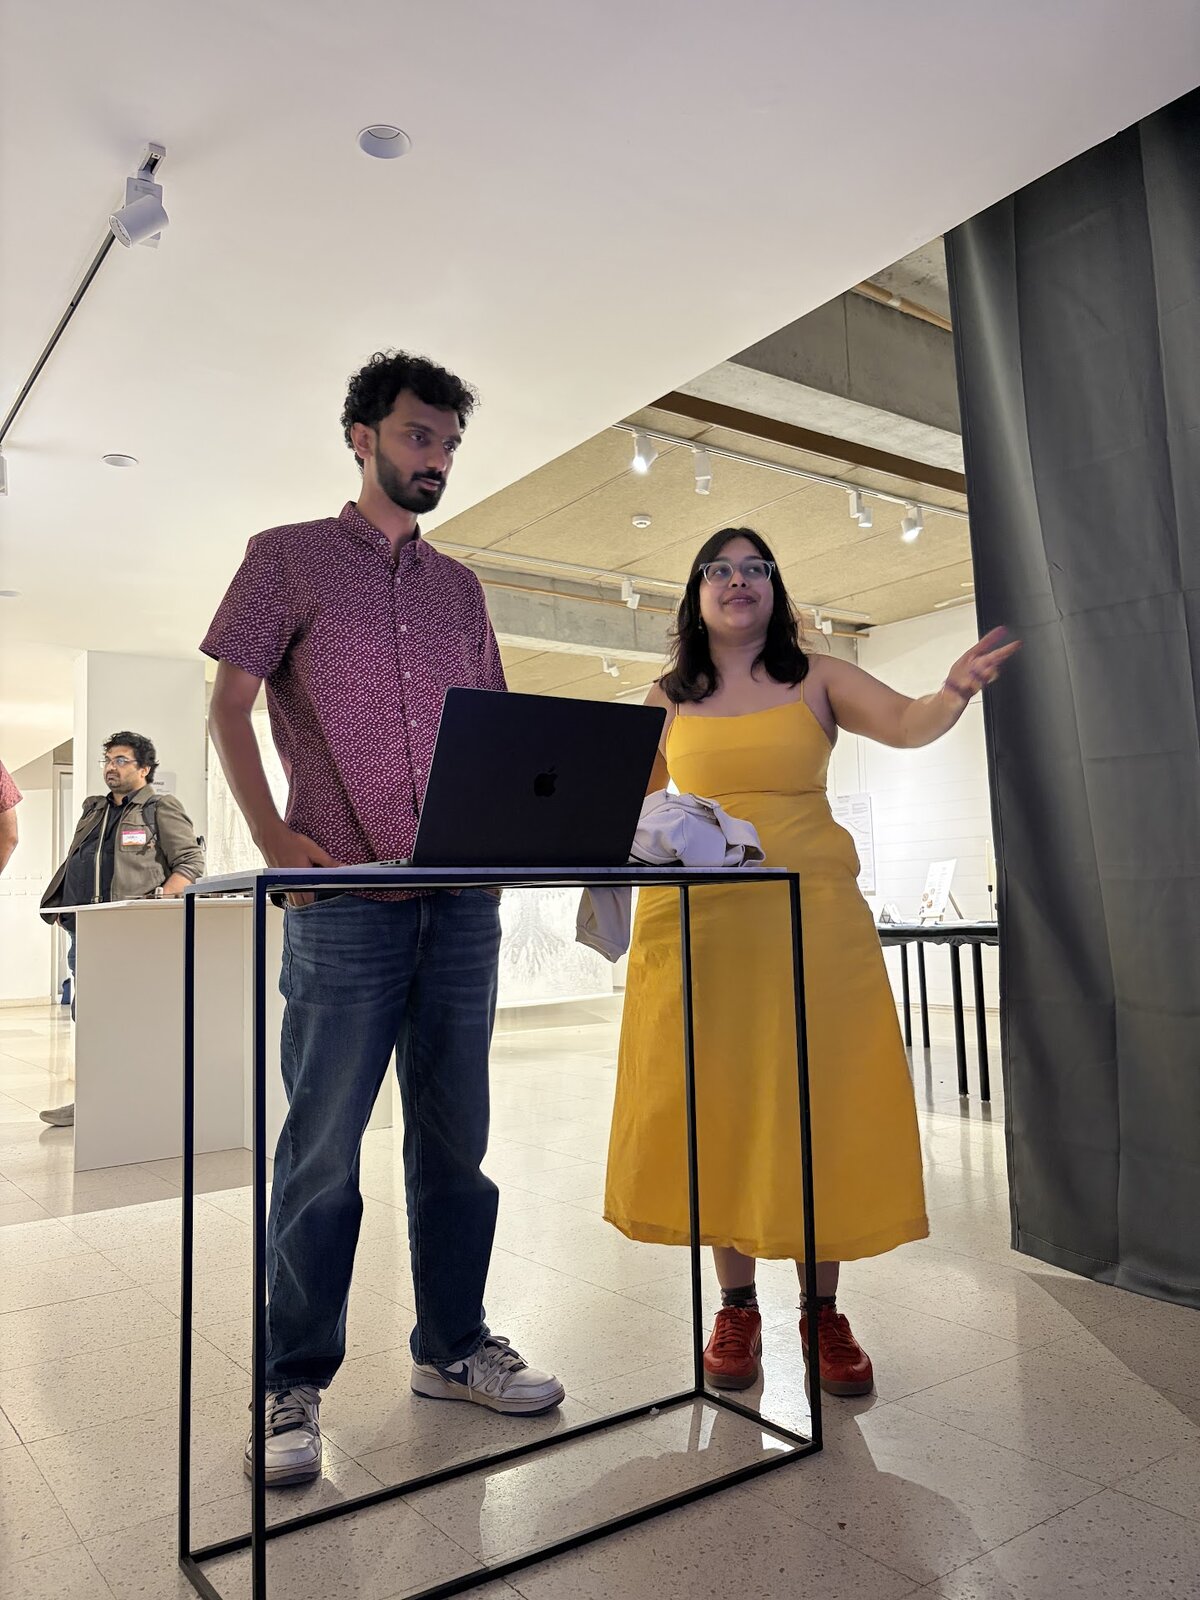
Assembled by many builders: Rachel, Kavi, Aditi, Saurabh, Paper Crane Lab, and Laser Smiths
Exhibited @ Bangalore International Centre alongside:
- Fading Out to Extinction by Aswanth Choyan
- Klimate Kundli by Nithya Kirti M. & Arkoprabho Bhattacharjee
- The Pollution That Wasn't by Diagram Chasing
- Puddle Beneath the Plate by Shreya Dan
- The Scent of Grounded Change by Sadhana Lokesh
- Silent Cities by Vishal Garg
- Vanishing Wings by Meghana Singh

Methodology
Recorded temperature is hourly two-metre temperature called T2M, a standard meteorological measurement representing the air temperature at 2 m above the Earth's surface.
Felt temperature is the Universal Thermal Climate Index (UTCI), which estimates how hot it actually feels by accounting for humidity, wind and solar radiation.
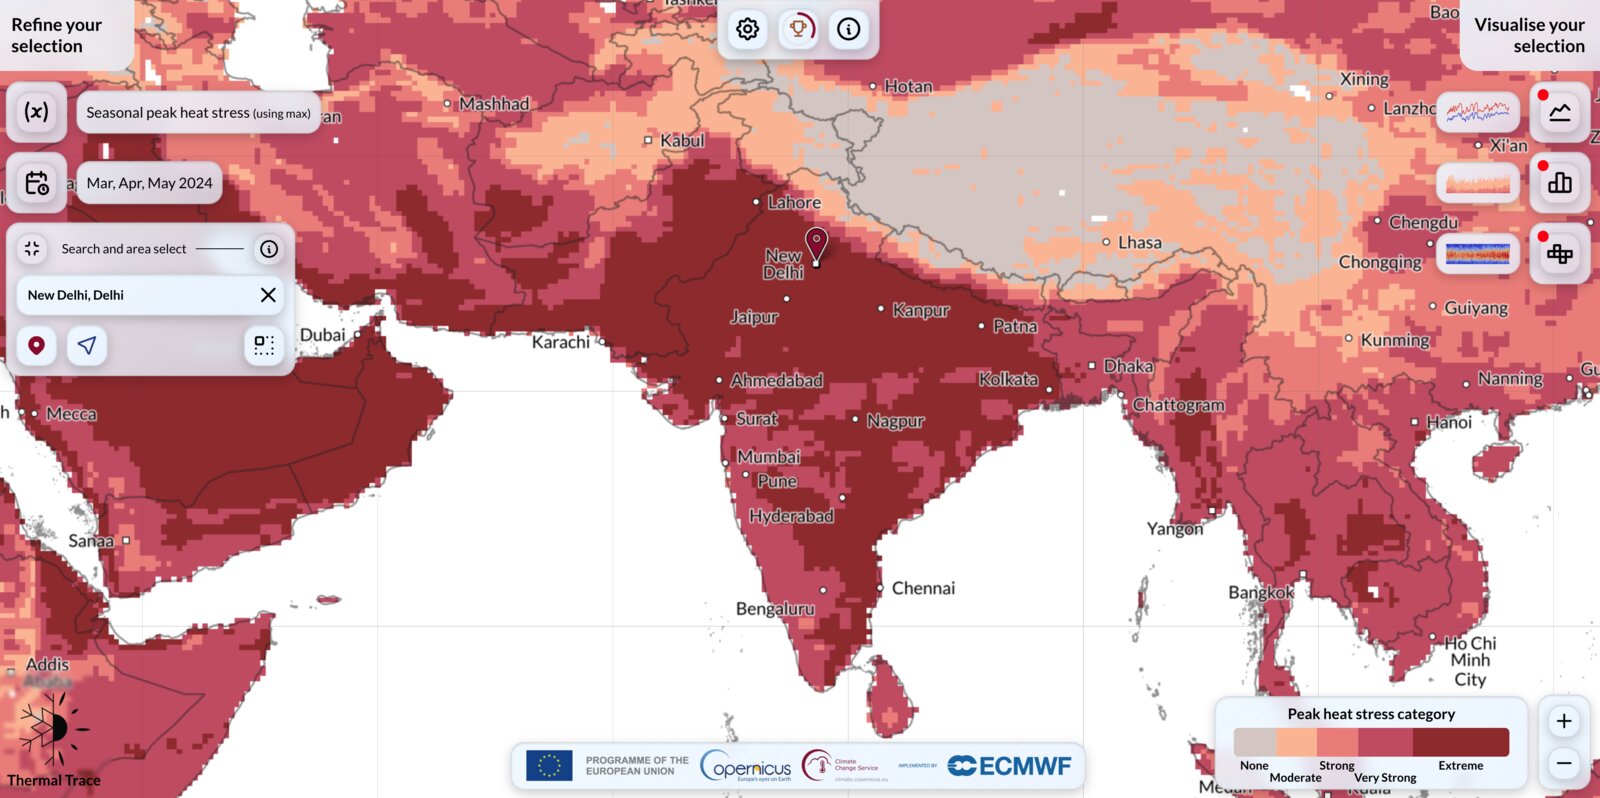
The data was retrieved from Copernicus Climate Data Store via Thermal Trace Explorer for each city's latitude and longitude coordinates, by simply replacing the latitude, longitude, variable and date range to get the corresponding time series.
GET https://apps.climate.copernicus.eu/thermal-trace-server/aggregated-timeseries-new
    ?x=<longitude>
    &y=<latitude>
    &temporal_agg=<yearly|seasonal|monthly|hourly>
    &r=0
    &variable=<utci|t2m>
    &start_time=<YYYY-MM-DD>
    &end_time=<YYYY-MM-DD>
    &apply_mask=false
All timestamps were converted from UTC to Indian Standard Time (IST), and the visualisations use a daytime window of 7:30 AM – 7:30 PM and a nighttime window of 7:30 PM – 7:30 AM.
Heat thresholds
Daytime thresholds follow the India Meteorological Department (IMD) heatwave criteria: 40 °C for plains (Delhi and Kolkata) and 37 °C for coastal cities (Mumbai and Chennai). For night-time analyses, we use a 30 °C threshold to identify warm nights.